
Key Points
- The current market cycle is characterized by low visibility and high uncertainty, with a significant financial-market correction underway.
- With growth risks dominating the agenda for investors, we expect bonds will play a positive role in portfolios.
- We believe that our approach of actively managing duration and credit risk, along with uncovering opportunities in credit and emerging markets, will be key in navigating the market backdrop.
There are two key factors at play that are driving bond markets. First, the current market cycle is characterized by low visibility and high uncertainty, with the probability of a global recession increasing. Second, there is a financial-market correction underway, particularly in equities and, to some extent, credit, with substantial downside risks remaining. The correction appears to be significant, particularly in areas with high concentration and valuations, such as artificial intelligence and related industries.
Therefore, we have these two elements to consider: a potentially weaker real economy, and softer financial markets. Overall, this environment should favor bonds.
Challenging Backdrop for Bonds
Nevertheless, bonds have not moved as much as expected. We think that this is because we are in a different regime, with two competing themes. This regime, which began following the Covid pandemic, has been characterized by inflationary pressures that are more structural in nature, accompanied by greater government intervention, as outlined by our big government theme. In addition, fiscal deficits remain high, and given the market correction that began in January, risks in markets have increased – underscoring the trends identified by our financialization theme.
This presents a backdrop that is challenging for bond investors; the increased supply of bonds, combined with fiscal concerns and inflationary pressures, has led to a difficult setup. Market participants have shown concern about the fiscal viability of some sovereigns, including the US, France and even the UK, leaving very little room to maneuver. Yields at the long end of the UK gilt market, for example, are still relatively high by historical standards.
What Does This Mean for the Role of Bonds in Portfolios?
We believe that bonds still play an important role, and that our approach of entering this year defensively was sensible. Given the backdrop, we think that active management of both duration and credit risk can be beneficial for investors this year, and this is how we are navigating the current market cycle. With growth risks dominating the agenda for investors, preceded by the correction in financial markets, we expect bonds will play a positive role in portfolios.
With growth risks dominating the agenda for investors, preceded by the correction in financial markets, we expect bonds will play a positive role in portfolios.
Opportunities
Given our defensive positioning so far this year, we think there are current opportunities to buy credit at cheap levels, particularly at high yields of 9% or over. We also think that emerging markets remain attractive on a structural basis.
In terms of currencies, we think that the US dollar appears overvalued, and while the speed of the dollar’s decline has been surprising, there is still some way to go. European currencies look to be in a better position, and with the challenges facing the US dollar, we expect that this will result in emerging-market currencies generally performing well. As we become more bearish on the dollar, we are likely to increase exposures to emerging-market currencies.
Overall, the current market cycle presents challenges and opportunities for fixed-income investors. By actively managing duration and credit risk and increasing exposure to credit and emerging-market currencies over the year, we believe a patient approach will be key to navigating this market backdrop.
Key points
- The current market cycle is characterised by low visibility and high uncertainty, with a significant financial-market correction underway.
- With growth risks dominating the agenda for investors, we expect bonds will play a positive role in portfolios.
- We believe that our approach of actively managing duration and credit risk, along with uncovering opportunities in credit and emerging markets, will be key in navigating the market backdrop.
There are two key factors at play that are driving bond markets. First, the current market cycle is characterised by low visibility and high uncertainty, with the probability of a global recession increasing. Second, there is a financial-market correction underway, particularly in equities and, to some extent, credit, with substantial downside risks remaining. The correction appears to be significant, particularly in areas with high concentration and valuations, such as artificial intelligence and related industries.
Therefore, we have these two elements to consider: a potentially weaker real economy, and softer financial markets. Overall, this environment should favour bonds.
Challenging backdrop for bonds
Nevertheless, bonds have not moved as much as expected. We think that this is because we are in a different regime, with two competing themes. This regime, which began following the Covid pandemic, has been characterised by inflationary pressures that are more structural in nature, accompanied by greater government intervention, as outlined by our big government theme. In addition, fiscal deficits remain high, and given the market correction that began in January, risks in markets have increased – underscoring the trends identified by our financialisation theme.
This presents a backdrop that is challenging for bond investors; the increased supply of bonds, combined with fiscal concerns and inflationary pressures, has led to a difficult setup. Market participants have shown concern about the fiscal viability of some sovereigns, including the US, France and even the UK, leaving very little room to manoeuvre. Yields at the long end of the UK gilt market, for example, are still relatively high by historical standards.
What does this mean for the role of bonds in portfolios?
We believe that bonds still play an important role, and that our approach of entering this year defensively was sensible. Given the backdrop, we think that active management of both duration and credit risk can be beneficial for investors this year, and this is how we are navigating the current market cycle. With growth risks dominating the agenda for investors, preceded by the correction in financial markets, we expect bonds will play a positive role in portfolios.
With growth risks dominating the agenda for investors, preceded by the correction in financial markets, we expect bonds will play a positive role in portfolios.
Opportunities
Given our defensive positioning so far this year, we think there are current opportunities to buy credit at cheap levels, particularly at high yields of 9% or over. We also think that emerging markets remain attractive on a structural basis.
In terms of currencies, we think that the US dollar appears overvalued, and while the speed of the dollar’s decline has been surprising, there is still some way to go. European currencies look to be in a better position, and with the challenges facing the US dollar, we expect that this will result in emerging-market currencies generally performing well. As we become more bearish on the dollar, we are likely to increase exposures to emerging-market currencies.
Overall, the current market cycle presents challenges and opportunities for fixed-income investors. By actively managing duration and credit risk and increasing exposure to credit and emerging-market currencies over the year, we believe a patient approach will be key to navigating this market backdrop.
Shifting sentiment
Financial-market participants began 2025 with optimism. Republicans had won a decisive victory in November’s US election, and the expectation was that President Donald Trump would implement policies similar to those enacted during his first term, with a focus on reducing regulation and extending tax cuts. The read-across was that such a backdrop would be broadly supportive for equities.
However, as the first quarter progressed, this sentiment shifted significantly, notably as a result of the new administration’s volatile trade policies. In addition, US foreign and defence policies underwent a major realignment, prompting European countries to begin boosting defence spending. Germany’s incoming coalition government immediately committed to loosening the country’s rigid fiscal rules, paving the way for a €500bn multi-year investment in infrastructure. Finally, the long-running artificial intelligence narrative was disrupted by reports that the Chinese-backed DeepSeek large language model could perform in line with more established US offerings at a fraction of the cost.
Equity markets
Total returns (£), rebased to 100 at 31.12.24
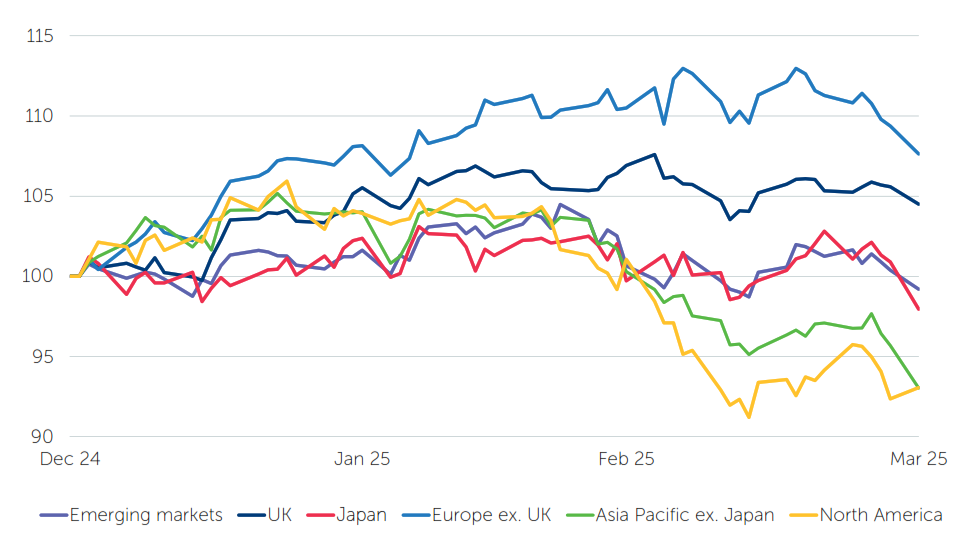
Note: all indices are FTSE series.
Source: FactSet, 31 March 2025.
In this environment, global equities overall declined over the three-month period, but a closer examination reveals a marked divergence between the performance of different regions and asset classes. The ‘magnificent seven’ US tech giants, which have been central to equity-market strength over the last two years, collectively entered bear market territory during the quarter.1 On the other hand, Europe’s pivot in favour of enhanced fiscal stimulus fuelled optimism that the region’s economy could gain momentum and propelled potential beneficiaries higher.2 The China-centric Hong Kong market also delivered strong returns.3
Meanwhile, gold, a traditional safe haven, experienced its best quarterly performance since 1986,4 boosted by concerns that the Trump administration’s tariff plans could widen the global trade war and trigger an economic slowdown. Benchmark 10-year US Treasury bonds ended the quarter with yields (which move inversely to prices) down over 0.35%.5 Conversely, Germany’s decision to lift its self-imposed debt brake for higher defence spending pushed German bund yields up.6 Elsewhere, 10-year Japanese government bond yields surged to their highest level since 2008, driven by expectations of further interest-rate hikes by the Bank of Japan.7
A new era of trade tariffs
It has quickly become clear that President Trump’s second term in the White House will not be a rerun of his first, and that his administration is set to use trade tariffs more broadly. However, the ultimate purpose of these tariffs is less certain. Is the purpose to generate revenue with the aim of reducing income taxes? Is it a negotiation strategy to persuade former allies, such as Canada and Mexico, to collectively impose tariffs on China as a North American trading bloc? Is the goal to rebalance global trade and incentivise the reindustrialisation of the US? Is it all of the above?
Economic challenges in the US and beyond
Regardless of the eventual outcome, the White House’s approach to trade policy is generating significant uncertainty for US companies and households. There are already observable signs of a material weakening in consumption, while consumer sentiment is beginning to turn sour.8
US Consumer Confidence Index
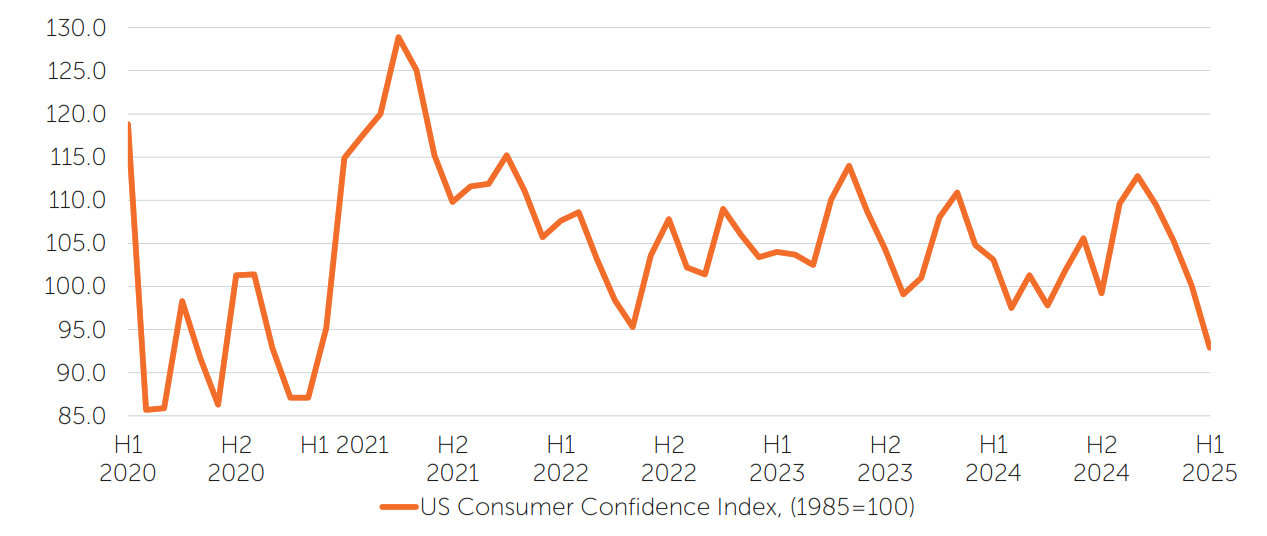
Source: US Conference Board, FactSet, April 2025.
With the growth of household incomes decelerating,9 an increase in prices due to tariffs, even if it occurs only once, is likely to exert substantial pressure on consumption. The downside risks to consumption will undoubtedly increase if businesses reduce hiring and investment.
The risks to the US economy are also influenced by the efforts of the newly established Department of Government Efficiency to pare back government spending. While there may be long-term benefits to reining in the size of the government, in the short term, reducing government expenditures is likely to decrease private-sector incomes and aggregate corporate profits, exerting additional pressure on the labour market and investment. During the first quarter, it has become apparent that the new administration is willing to endure short-term economic challenges in pursuit of longer-term objectives.
The economic impact of tariffs will not be borne solely by the US, especially if other countries reciprocate with similar measures. The White House may be employing tariffs as a means to encourage other countries to lower their own tariffs. While this may ultimately be successful, there is also a possibility that both sides may perceive the other as having initiated the conflict. Consequently, US reciprocal tariffs could represent the first shots fired in an ongoing trade war.
Higher barriers to trade are likely to have a negative impact on global hiring and investment. Although there has been an easing of fiscal policy in Germany and a seemingly more unified Europe, the likelihood of the US experiencing a significant economic slowdown – and potentially a recession – while the rest of the world does not is low. Nonetheless, as it becomes increasingly evident to other nations that they can no longer depend on the US in the same manner as before, countries are having to take matters into their own hands.
Investment opportunities amid a divergent backdrop
In this environment, we observe increasingly divergent monetary and fiscal policies. For several years, we have maintained that peak globalisation is in the rearview mirror, with the global order shifting towards increasing divergence. This perspective has gradually proven accurate, and the current US administration’s approach is accelerating this trend. Consequently, investors should encounter a broader range of opportunities across different regions, as the world’s primary economic blocs become progressively less synchronised.
The outlook for equities in the upcoming months, and potentially quarters, may be adversely affected by central banks’ caution. For now, at least, these policymakers are equally concerned about the inflationary pressures posed by tariffs as they are with the potential decline in economic growth. ‘Uncertainty’ is the watchword of major central banks, with the US Federal Reserve (Fed) notably adopting a ‘wait and see’ approach.10 In our view, there is a risk that should the Fed delay interest-rate cuts until economic indicators justify such action, any resultant economic slowdown may be more severe than it might have been with earlier intervention.
From a long-term perspective, investors face two contrasting potential outcomes. On the one hand, an intensifying trade war could cause a prolonged global recession. On the other, assertiveness from the US in trade policy might prompt other nations to reduce their trade barriers, potentially fostering increased globalisation.
It is virtually impossible to predict how the current backdrop will evolve, and it is therefore prudent to exercise caution and refrain from assuming more knowledge than we possess. In this context, and considering the potential for significant geopolitical developments, we believe that the attributes of resilient, liquid and diversifying portfolios are likely to come to the fore. Furthermore, we think a discerning approach to security selection will be crucial in identifying those investments that can harness their unique strengths and adapt to changing market conditions. Prized characteristics such as durable business models, robust cash generation and solid balance sheets should help investments to navigate a potentially volatile backdrop.
1 Source: FactSet, 31 March 2025
2 European Stocks Surge Ahead Of S&P 500 In Q1 2025, Forbes, 31 March 2025
3 Chinese investors pour record funds into Hong Kong stocks in first quarter, Reuters, 28 March 2025
4 Source: FactSet, 31 March 2025
5 Source: FactSet, 31 March 2025
6 Markets in Q1: Everything’s been Trumped!, Reuters, 31 March 2025
7 Source: FactSet, 31 March 2025
8 Rising fears of tariffs pummel US consumer confidence to four-year low, Reuters, 25 March 2025
9 Threats to U.S. Household Income Growth, Moody’s Analytics, 11 February 2025
10 Fed in no rush to cut rates; Trump disagrees, Reuters, 20 March 2025
Shifting Sentiment
Financial-market participants began 2025 with optimism. Republicans had won a decisive victory in November’s US election, and the expectation was that President Donald Trump would implement policies similar to those enacted during his first term, with a focus on reducing regulation and extending tax cuts. The read-across was that such a backdrop would be broadly supportive for equities.
However, as the first quarter progressed, this sentiment shifted significantly, notably as a result of the new administration’s volatile trade policies. In addition, US foreign and defense policies underwent a major realignment, prompting European countries to begin boosting defense spending. Germany’s incoming coalition government immediately committed to loosening the country’s rigid fiscal rules, paving the way for a €500bn multi-year investment in infrastructure. Finally, the long-running artificial intelligence narrative was disrupted by reports that the Chinese-backed DeepSeek large language model could perform in line with more established US offerings at a fraction of the cost.
Equity Markets
Total returns (US$), rebased to 100 at 12.31.24
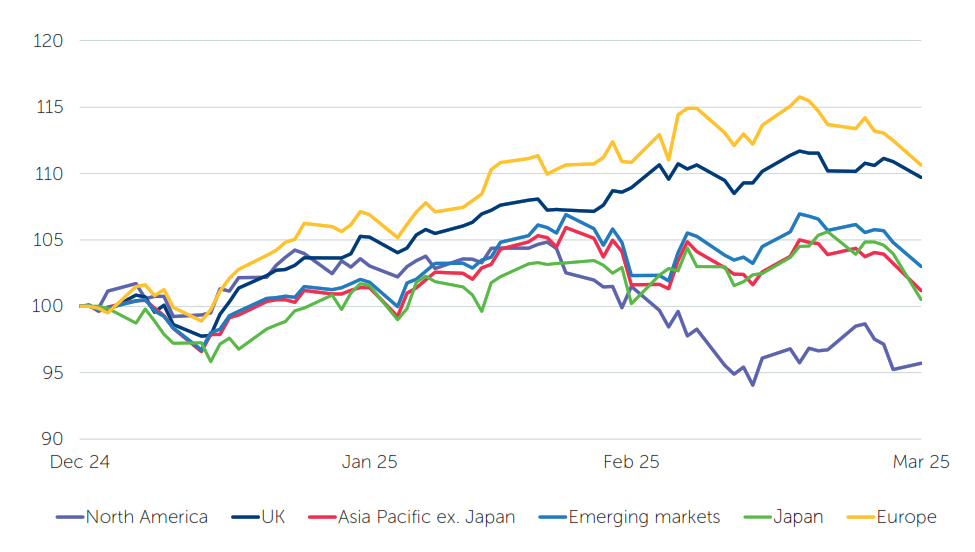
Note: all indices are MSCI series.
Source: FactSet, March 31, 2025.
In this environment, global equities overall declined over the three-month period, but a closer examination reveals a marked divergence between the performance of different regions and asset classes. The ‘magnificent seven’ US tech giants, which have been central to equity-market strength over the last two years, collectively entered bear market territory during the quarter.1 On the other hand, Europe’s pivot in favor of enhanced fiscal stimulus fueled optimism that the region’s economy could gain momentum, and propelled potential beneficiaries higher.2 The China-centric Hong Kong market also delivered strong returns.3
Meanwhile, gold, a traditional safe haven, experienced its best quarterly performance since 1986,4 boosted by concerns that the Trump administration’s tariff plans could widen the global trade war and trigger an economic slowdown. Benchmark 10-year US Treasury bonds ended the quarter with yields (which move inversely to prices) down over 0.35%.5 Conversely, Germany’s decision to lift its self-imposed debt brake for higher defense spending pushed German bund yields up.6 Elsewhere, 10-year Japanese government bond yields surged to their highest level since 2008, driven by expectations of further interest-rate hikes by the Bank of Japan.7
A New Era of Trade Tariffs
It has quickly become clear that President Trump’s second term in the White House will not be a rerun of his first, and that his administration is set to use of trade tariffs more broadly. However, the ultimate purpose of these tariffs is less certain. Is the purpose to generate revenue with the aim of reducing income taxes? Is it a negotiation strategy to persuade former allies, such as Canada and Mexico, to collectively impose tariffs on China as a North American trading bloc? Is the goal to rebalance global trade and incentivize the reindustrialization of the US? Is it all of the above?
Economic Challenges in the US and Beyond
Regardless of the eventual outcome, the White House’s approach to trade policy is generating significant uncertainty for US companies and households. There are already observable signs of a material weakening in consumption, while consumer sentiment is beginning to turn sour.8
US Consumer Confidence Index
Source: US Conference Board, FactSet, April 2025.
With the growth of household incomes decelerating,9 an increase in prices due to tariffs, even if it occurs only once, is likely to exert substantial pressure on consumption. The downside risks to consumption will undoubtedly increase if businesses reduce hiring and investment.
The risks to the US economy are also influenced by the efforts of the newly established Department of Government Efficiency to pare back government spending. While there may be long-term benefits to reining in the size of the government, in the short term, reducing government expenditures is likely to decrease private-sector incomes and aggregate corporate profits, exerting additional pressure on the labor market and investment. During the first quarter, it has become apparent that the new administration is willing to endure short-term economic challenges in pursuit of longer-term objectives.
The economic impact of tariffs will not be borne solely by the US, especially if other countries reciprocate with similar measures. The White House may be employing tariffs as a means to encourage other countries to lower their own tariffs. While this may ultimately be successful, there is also a possibility that both sides may perceive the other as having initiated the conflict. Consequently, US reciprocal tariffs could represent the first shots fired in an ongoing trade war.
Higher barriers to trade are likely to have a negative impact on global hiring and investment. Although there has been an easing of fiscal policy in Germany and a seemingly more unified Europe, the likelihood of the US experiencing a significant economic slowdown – and potentially a recession – while the rest of the world does not is low. Nonetheless, as it becomes increasingly evident to other nations that they can no longer depend on the US in the same manner as before, countries are having to take matters into their own hands.
Investment Opportunities amid a Divergent Backdrop
In this environment, we observe increasingly divergent monetary and fiscal policies. For several years, we have maintained that peak globalization is in the rearview mirror, with the global order shifting towards increasing divergence. This perspective has gradually proven accurate, and the current US administration’s approach is accelerating this trend. Consequently, investors should encounter a broader range of opportunities across different regions, as the world’s primary economic blocs become progressively less synchronized.
The outlook for equities in the upcoming months, and potentially quarters, may be adversely affected by central banks’ caution. For now, at least, these policymakers are equally concerned about the inflationary pressures posed by tariffs as they are with the potential decline in economic growth. ‘Uncertainty’ is the watchword of major central banks, with the US Federal Reserve (Fed) notably adopting a ‘wait and see’ approach.10 In our view, there is a risk that should the Fed delay interest-rate cuts until economic indicators justify such action, any resultant economic slowdown may be more severe than it might have been with earlier intervention.
From a long-term perspective, investors face two contrasting potential outcomes. On the one hand, an intensifying trade war could cause a prolonged global recession. On the other, assertiveness from the US in trade policy might prompt other nations to reduce their trade barriers, potentially fostering increased globalization.
It is virtually impossible to predict how the current backdrop will evolve, and it is therefore prudent to exercise caution and refrain from assuming more knowledge than we possess. In this context, and considering the potential for significant geopolitical developments, we believe that the attributes of resilient, liquid and diversifying portfolios are likely to come to the fore. Furthermore, we think a discerning approach to security selection will be crucial in identifying those investments that can harness their unique strengths and adapt to changing market conditions. Prized characteristics such as durable business models, robust cash generation and solid balance sheets should help investments to navigate a potentially volatile backdrop.
1 Source: FactSet, March 31, 2025
2 European Stocks Surge Ahead Of S&P 500 In Q1 2025, Forbes, March 31, 2025
3 Chinese investors pour record funds into Hong Kong stocks in first quarter, Reuters, March 28, 2025
4 Source: FactSet, March 31, 2025
5 Source: FactSet, March 31, 2025
6 Markets in Q1: Everything’s been Trumped!, Reuters, March 31, 2025
7 Source: FactSet, March 31, 2025
8 Rising fears of tariffs pummel US consumer confidence to four-year low, Reuters, March 25, 2025
9 Threats to U.S. Household Income Growth, Moody’s Analytics, February 11, 2025
10 Fed in no rush to cut rates; Trump disagrees, Reuters, March 20, 2025
Shifting sentiment
Financial-market participants began 2025 with optimism. Republicans had won a decisive victory in November’s US election, and the expectation was that President Donald Trump would implement policies similar to those enacted during his first term, with a focus on reducing regulation and extending tax cuts. The read-across was that such a backdrop would be broadly supportive for equities.
However, as the first quarter progressed, this sentiment shifted significantly, notably as a result of the new administration’s volatile trade policies. In addition, US foreign and defence policies underwent a major realignment, prompting European countries to begin boosting defence spending. Germany’s incoming coalition government immediately committed to loosening the country’s rigid fiscal rules, paving the way for a €500bn multi-year investment in infrastructure. Finally, the long-running artificial intelligence narrative was disrupted by reports that the Chinese-backed DeepSeek large language model could perform in line with more established US offerings at a fraction of the cost.
Equity markets
Total returns (£), rebased to 100 at 31.12.24
Note: all indices are FTSE series.
Source: FactSet, 31 March 2025.
In this environment, global equities overall declined over the three-month period, but a closer examination reveals a marked divergence between the performance of different regions and asset classes. The ‘magnificent seven’ US tech giants, which have been central to equity-market strength over the last two years, collectively entered bear market territory during the quarter.1 On the other hand, Europe’s pivot in favour of enhanced fiscal stimulus fuelled optimism that the region’s economy could gain momentum and propelled potential beneficiaries higher.2 The China-centric Hong Kong market also delivered strong returns.3
Meanwhile, gold, a traditional safe haven, experienced its best quarterly performance since 1986,4 boosted by concerns that the Trump administration’s tariff plans could widen the global trade war and trigger an economic slowdown. Benchmark 10-year US Treasury bonds ended the quarter with yields (which move inversely to prices) down over 0.35%.5 Conversely, Germany’s decision to lift its self-imposed debt brake for higher defence spending pushed German bund yields up.6 Elsewhere, 10-year Japanese government bond yields surged to their highest level since 2008, driven by expectations of further interest-rate hikes by the Bank of Japan.7
A new era of trade tariffs
It has quickly become clear that President Trump’s second term in the White House will not be a rerun of his first, and that his administration is set to use trade tariffs more broadly. However, the ultimate purpose of these tariffs is less certain. Is the purpose to generate revenue with the aim of reducing income taxes? Is it a negotiation strategy to persuade former allies, such as Canada and Mexico, to collectively impose tariffs on China as a North American trading bloc? Is the goal to rebalance global trade and incentivise the reindustrialisation of the US? Is it all of the above?
Economic challenges in the US and beyond
Regardless of the eventual outcome, the White House’s approach to trade policy is generating significant uncertainty for US companies and households. There are already observable signs of a material weakening in consumption, while consumer sentiment is beginning to turn sour.8
US Consumer Confidence Index
Source: US Conference Board, FactSet, April 2025.
With the growth of household incomes decelerating,9 an increase in prices due to tariffs, even if it occurs only once, is likely to exert substantial pressure on consumption. The downside risks to consumption will undoubtedly increase if businesses reduce hiring and investment.
The risks to the US economy are also influenced by the efforts of the newly established Department of Government Efficiency to pare back government spending. While there may be long-term benefits to reining in the size of the government, in the short term, reducing government expenditures is likely to decrease private-sector incomes and aggregate corporate profits, exerting additional pressure on the labour market and investment. During the first quarter, it has become apparent that the new administration is willing to endure short-term economic challenges in pursuit of longer-term objectives.
The economic impact of tariffs will not be borne solely by the US, especially if other countries reciprocate with similar measures. The White House may be employing tariffs as a means to encourage other countries to lower their own tariffs. While this may ultimately be successful, there is also a possibility that both sides may perceive the other as having initiated the conflict. Consequently, US reciprocal tariffs could represent the first shots fired in an ongoing trade war.
Higher barriers to trade are likely to have a negative impact on global hiring and investment. Although there has been an easing of fiscal policy in Germany and a seemingly more unified Europe, the likelihood of the US experiencing a significant economic slowdown – and potentially a recession – while the rest of the world does not is low. Nonetheless, as it becomes increasingly evident to other nations that they can no longer depend on the US in the same manner as before, countries are having to take matters into their own hands.
Investment opportunities amid a divergent backdrop
In this environment, we observe increasingly divergent monetary and fiscal policies. For several years, we have maintained that peak globalisation is in the rearview mirror, with the global order shifting towards increasing divergence. This perspective has gradually proven accurate, and the current US administration’s approach is accelerating this trend. Consequently, investors should encounter a broader range of opportunities across different regions, as the world’s primary economic blocs become progressively less synchronised.
The outlook for equities in the upcoming months, and potentially quarters, may be adversely affected by central banks’ caution. For now, at least, these policymakers are equally concerned about the inflationary pressures posed by tariffs as they are with the potential decline in economic growth. ‘Uncertainty’ is the watchword of major central banks, with the US Federal Reserve (Fed) notably adopting a ‘wait and see’ approach.10 In our view, there is a risk that should the Fed delay interest-rate cuts until economic indicators justify such action, any resultant economic slowdown may be more severe than it might have been with earlier intervention.
From a long-term perspective, investors face two contrasting potential outcomes. On the one hand, an intensifying trade war could cause a prolonged global recession. On the other, assertiveness from the US in trade policy might prompt other nations to reduce their trade barriers, potentially fostering increased globalisation.
It is virtually impossible to predict how the current backdrop will evolve, and it is therefore prudent to exercise caution and refrain from assuming more knowledge than we possess. In this context, and considering the potential for significant geopolitical developments, we believe that the attributes of resilient, liquid and diversifying portfolios are likely to come to the fore. Furthermore, we think a discerning approach to security selection will be crucial in identifying those investments that can harness their unique strengths and adapt to changing market conditions. Prized characteristics such as durable business models, robust cash generation and solid balance sheets should help investments to navigate a potentially volatile backdrop.
1 Source: FactSet, 31 March 2025
2 European Stocks Surge Ahead Of S&P 500 In Q1 2025, Forbes, 31 March 2025
3 Chinese investors pour record funds into Hong Kong stocks in first quarter, Reuters, 28 March 2025
4 Source: FactSet, 31 March 2025
5 Source: FactSet, 31 March 2025
6 Markets in Q1: Everything’s been Trumped!, Reuters, 31 March 2025
7 Source: FactSet, 31 March 2025
8 Rising fears of tariffs pummel US consumer confidence to four-year low, Reuters, 25 March 2025
9 Threats to U.S. Household Income Growth, Moody’s Analytics, 11 February 2025
10 Fed in no rush to cut rates; Trump disagrees, Reuters, 20 March 2025
Paul Stimers, partner at Holland & Knight and founder of the Quantum Industry Coalition, joins Double Take to jump into the quantum advantage, cybersecurity implications and the future of this groundbreaking technology.
The podcast is intended for investment professionals ONLY and should not be construed as investment advice or a recommendation. Any stock examples discussed are given in the context of the theme being explored and the views expressed are those of the presenters at the time of recording.
Listen on
Key points
- Donald Trump’s trade tariffs are widely expected by the market to be inflationary.
- But are tariffs more of a bargaining tool for ‘dealmaker’ Trump than a strong inflationary force? Could deglobalisation keep inflation higher than during the last decade?
- Policy uncertainty could potentially cause an economic slowdown in the short term; however, Trump’s deregulatory stance could provide a boost to the US economy as well as the banking and energy sectors.
US President Donald Trump’s trade tariffs are widely expected to have an inflationary effect on the US domestic economy. However, rather than being outright inflationary, we think tariffs are more of a bargaining tool for Trump to achieve certain fiscal objectives. This has led to an increase in policy uncertainty, which could lead to slower economic activity.
Since his inauguration, Trump has imposed tariffs of 25% on imports from Canada and Mexico,[1] and 20% on imports from China.[2] He has also threatened tariffs on the European Union and committed to so-called reciprocal tariffs on a range of other countries.[3] The fear is that tariffs could ramp up the cost of goods for US importers who could pass these on to retailers and, in turn, to end consumers.
Nevertheless, while we believe there are certainly inflationary forces at play in the global economy, such as secular drivers like deglobalisation and decarbonisation, our views on tariffs as a contributing factor are more sanguine. We do not think tariffs will be as inflationary as the market fears.
We do not think tariffs will be as inflationary as the market fears.
External revenue
As part of this deal making, we would highlight Trump’s rhetoric on creating an “external revenue service.” [4] The intention of this is to collect tariffs, duties and revenue from foreign sources to relieve the tax burden on internal sources, i.e. domestic companies.
Trump believes there should be an external revenue service. When it comes to renegotiating tax policy in 2025, we could see tariffs as part of that package – the idea being to generate more revenue from external partners, maybe through broader tariffs, at the same time as cutting taxes internally.
It is indeterminate whether this is inflationary or not, so we are not convinced that tariffs overall will be inflationary. However, we do believe that interest rates around current levels probably make sense for the economy and the yield curve may be a little steeper. Importantly, it has led to policy uncertainty which could potentially lead to an economic downturn in the short term.
Banks
As well as imposing tariffs, Trump is seeking to roll back regulation across a wide range of industries. This has been evidenced by a flurry of executive orders since his inauguration, tackling areas including government spending, defence, immigration and climate.[5]
Banking is another sector that we believe could come under Trump’s deregulatory lens. Prior to Trump’s inauguration, the Federal Reserve announced a cut to a proposed increase to capital requirements under the Basel III regulation.[6] But we think there is a possibility that the Trump administration could water this down further.[7]
During the 2008 global financial crisis, more regulation was required and the banks needed more capital. They have spent over a decade building capital levels and the banks in the US, especially the large banks, are now in very good shape.
If capital requirements are indeed left untouched, we believe financial stocks could help stimulate the economy through increased lending activity. They could also return more capital to shareholders in the form of dividends.
If capital requirements are indeed left untouched, we believe financial stocks could help stimulate the economy through increased lending activity.
Energy
Energy is another sector potentially in line for a cutback in regulation. Trump’s ‘drill, baby, drill’ pledge could increase the domestic supply of oil and natural gas but that could be offset by a tougher diplomatic stance on Iran and Venezuela, restricting supply. [8][9] When you net these two forces, the oil price and natural-gas price appear to be favourable at their current levels.
We are positive on natural-gas players because of the huge electricity demand needed in the US to support the manufacturing renaissance that Trump is seeking to enable through lower taxes on domestic companies. We see this trend continuing.
We would also caution investors about getting too excited about a coming surge in US energy supply. Trump telling the energy companies to ramp up production is like ‘pushing on a string’. Many of these companies have become much more disciplined over the last decade and have increasingly focused on returning capital to shareholders through dividends and buybacks as opposed to increasing production. We believe this is positive for dividend investors.
[1] FT. Donald Trump confirms he will impose 25% tariffs on Mexico and Canada on Tuesday. 3 March 2025.
[2] FT. US to raise tariffs on China and push ahead with Canada and Mexico levies. 28 February 2025.
[3] FT. Donald Trump threatens to impose 25% tariffs on EU goods. 26 February 2025
[4] Guardian. Trump says he will create ‘external revenue service’ to collect tariff income. 14 January 2025.
[5] BBC. What has Trump done since taking power. 29 January 2025.
[6] FT. Federal Reserve halves proposed capital requirement rise for largest US banks. 10 September 2024.
[7] The Banker. Further Basel delays expected as UK and EU wait on Trump. 20 January 2025.
[8] BBC. Trump vows to leave Paris climate agreement and ‘drill, baby, drill’. 21 January 2025.
[9] The National. Trump-led US may tighten oil markets with stricter sanctions on Iran and Venezuela. 6 November 2024.
Key Points
- Donald Trump’s trade tariffs are widely expected by the market to be inflationary.
- But are tariffs more of a bargaining tool for ‘dealmaker’ Trump than a strong inflationary force? Could deglobalization keep inflation higher than during the last decade?
- Policy uncertainty could potentially cause an economic slowdown in the short term; however, Trump’s deregulatory stance could provide a boost to the US economy as well as the banking and energy sectors.
Donald Trump’s trade tariffs are widely expected to have an inflationary effect on the domestic economy. However, rather than being outright inflationary, we think tariffs are more of a bargaining tool for Trump to achieve certain fiscal objectives. This has led to an increase in policy uncertainty, which could lead to slower economic activity.
Since his inauguration, Trump has imposed tariffs of 25% on imports from Canada and Mexico,[1] and 20% on imports from China.[2] He has also threatened tariffs on the European Union and committed to so-called reciprocal tariffs on a range of other countries.[3] The fear is that tariffs could ramp up the cost of goods for US importers who could pass these on to retailers and, in turn, to end consumers.
Nevertheless, while we believe there are certainly inflationary forces at play in the global economy, such as secular drivers like deglobalization and decarbonization, our views on tariffs as a contributing factor are more sanguine. We do not think tariffs will be as inflationary as the market fears.
We do not think tariffs will be as inflationary as the market fears.
External Revenue
As part of this deal making, we would highlight Trump’s rhetoric on creating an “external revenue service.” [4] The intention of this is to collect tariffs, duties and revenue from foreign sources to relieve the tax burden on internal sources, i.e. domestic companies.
Trump believes there should be an external revenue service. When it comes to renegotiating tax policy in 2025, we could see tariffs as part of that package – the idea being to generate more revenue from external partners, maybe through broader tariffs, at the same time as cutting taxes internally.
It is indeterminate whether this is inflationary or not, so we are not convinced that tariffs overall will be inflationary. However, we do believe that interest rates around current levels probably make sense for the economy and the yield curve may be a little steeper. Importantly, it has led to policy uncertainty which could potentially lead to an economic downturn in the short term.
Banks
As well as imposing tariffs, Trump is seeking to roll back regulation across a wide range of industries. This has been evidenced by a flurry of executive orders since his inauguration, tackling areas including government spending, defense, immigration and climate.[5]
Banking is another sector that we believe could come under Trump’s deregulatory lens. Prior to Trump’s inauguration, the Federal Reserve announced a cut to a proposed increase to capital requirements under the Basel III regulation.[6] But we think there is a possibility that the Trump administration could water this down further.[7]
During the 2008 global financial crisis, more regulation was required and the banks needed more capital. They have spent over a decade building capital levels and the banks in the US, especially the large banks, are now in very good shape.
If capital requirements are indeed left untouched, we believe financial stocks could help stimulate the economy through increased lending activity. They could also return more capital to shareholders in the form of dividends.
If capital requirements are indeed left untouched, we believe financial stocks could help stimulate the economy through increased lending activity.
Energy
Energy is another sector potentially in line for a cutback in regulation. Trump’s “drill, baby, drill” pledge could increase the domestic supply of oil and natural gas but that could be offset by a tougher diplomatic stance on Iran and Venezuela, restricting supply. [8][9] When you net these two forces, the oil price and natural-gas price appear to be favorable at their current levels.
We are positive on natural-gas players because of the huge electricity demand needed in the US to support the manufacturing renaissance that Trump is seeking to enable through lower taxes on domestic companies. We see this trend continuing.
We would also caution investors about getting too excited about a coming surge in US energy supply. Trump telling the energy companies to ramp up production is like ‘pushing on a string.’ Many of these companies have become much more disciplined over the last decade and have increasingly focused on returning capital to shareholders through dividends and buybacks as opposed to increasing production. We believe this is positive for dividend investors.
[1] FT. Donald Trump confirms he will impose 25% tariffs on Mexico and Canada on Tuesday. March 3, 2025.
[2] FT. US to raise tariffs on China and push ahead with Canada and Mexico levies. February 28, 2025.
[3] FT. Donald Trump threatens to impose 25% tariffs on EU goods. February 26, 2025
[4] Guardian. Trump says he will create ‘external revenue service’ to collect tariff income. January 14, 2025.
[5] BBC. What has Trump done since taking power. January 29, 2025.
[6] FT. Federal Reserve halves proposed capital requirement rise for largest US banks. September 10, 2024.
[7] The Banker. Further Basel delays expected as UK and EU wait on Trump. January 20, 2025.
[8] BBC. Trump vows to leave Paris climate agreement and ‘drill, baby, drill’. January 21, 2025.
[9] The National. Trump-led US may tighten oil markets with stricter sanctions on Iran and Venezuela. November 6, 2024.
Paul Stimers, partner at Holland & Knight and founder of the Quantum Industry Coalition, joins Double Take to jump into the quantum advantage, cybersecurity implications and the future of this groundbreaking technology.
The podcast is intended for investment professionals ONLY and should not be construed as investment advice or a recommendation. Any stock examples discussed are given in the context of the theme being explored and the views expressed are those of the presenters at the time of recording.
Listen on
Richard Eisenbarth, president emeritus of Cini-Little International, Inc., joins Double Take to stew over the increasing role of artificial intelligence and automation in the food-service industry, marinating on how these technologies are transforming kitchen operations and affecting the industry.
The podcast is intended for investment professionals ONLY and should not be construed as investment advice or a recommendation. Any stock examples discussed are given in the context of the theme being explored and the views expressed are those of the presenters at the time of recording.