
Key Points
- We believe investors should consider European infrastructure for greater diversification due to favorable valuations and lower exposure to the expensive artificial intelligence (AI) boom in the US.
- Tailwinds for European utilities include government incentives, sector dislocation and rising investment in energy independence.
- Data-center growth is likely to drive significant power demand, creating long-term revenue growth opportunities for utilities and accelerating green-energy investments.
- The Nordic countries, due to their renewable-energy resources, cold climate and strong regulatory frameworks, are well positioned to benefit from the data center and AI boom.
In last year’s blog post, Coming to America: Investing in Utilities, we highlighted the tailwinds for US utility companies that included significant sector dislocation, government decarbonization incentives and investments in energy. However, the winds of change are at work once again, with the same drivers now appearing in Europe. We believe that investors should consider greater exposure to European infrastructure.
The Death of Equity Diversification–A Decade in Review
Global equities have recently hit a series of new all-time highs, as measured by the MSCI World Index, but returns have been led by a handful of large US growth stocks—the ‘magnificent seven’—whose performance has been driven by the promise of future growth from artificial intelligence (AI). These seven stocks have contributed 30% to global equities’ cumulative return of 155% over the past ten years through December 31, 2024, despite comprising only 11% of the benchmark, on average, during the period. The US has contributed 75% of the total returns with an average weight of 56%, while the US information technology sector has contributed 38% of global equity returns, with an average weight of 19%.
Not surprisingly, over the past ten years the US grew from 51% of the global equity market to 65%, while Europe decreased from 22% to 14%. Information technology increased from 14% to 26% of the MSCI World Index, while the combined weight of the industrials, utilities, energy and materials sectors fell from 27% to 20%.
The narrowness of the market rally was even more pronounced in the US, where the magnificent seven stocks contributed 29% of the S&P 500® Index’s cumulative 242% return over the previous ten years through December 31, 2024. The information technology sector grew from 19% of the S&P 500 to 33% over the same period and contributed 42% of S&P 500’s return despite an average weight of 25%. Together, the weight of the industrials, utilities, energy and materials sectors has fallen from 25% of the S&P 500 ten years ago to 15.5% at the end of 2024. The four infrastructure-exposed sectors started 5% bigger than information technology and ended 17% smaller.
New record highs would suggest that the entire US equity market is expensive. However, lack of market breadth has been the key story of the equity rally. The substantial weighting of these stocks has posed a challenge for investors who rely on the S&P 500 for diversification. Specifically, infrastructure stocks have become notably underrepresented within a typical S&P 500 equity allocation.
We suggest that investors seeking greater diversification should consider the infrastructure sector and specifically should look to European infrastructure where valuations have not been amplified by the expensive AI power boom.
2024 in Review
In the year since we published Coming to America: Investing in Utilities, in which we laid out our case for infrastructure investment within the US, the valuation dispersion between US and European utilities has grown. Over the calendar year 2024, the S&P 500 utilities sector appreciated 27% while European utilities were flat. A key driver of the US appreciation and relative outperformance was the significant capital expenditure of US mega-cap technology companies to support the build-out of the AI ecosystem. These investments in infrastructure, especially related to power, show no signs of stopping. Independent power producers and electric-utilities companies have been among the biggest beneficiaries due to the rising demand for electricity. Hyperscalers’ willingness to secure power at above-market rates also plays a role as they seek to ensure the powering of large data centers in support of their AI aspirations.
So, why do we believe now is a good time to allocate to Europe?
European Competitiveness
The key reasons we believe there is opportunity for active managers in European utilities are identical to the reasons we were bullish on the US in 2024:
- Government incentives aimed at decarbonization can provide tailwinds for renewables-exposed utilities.
- We believe there is a significant sector dislocation in European utilities, potentially unlocking opportunity for active managers.
- We believe electrification and investments in energy independence may continue to drive European electric and gas utilities.
European Government Support
We believe that infrastructure support for AI is a global goal essential for maintaining competitiveness in leading-edge technology. In addition, due to data privacy concerns, we believe countries will want to control their own technology and data, which will require them to build data centers domestically. Europe has fallen behind technology leaders in the US and China, and European officials have become more vocal about the need to act. In January 2025, the areas we feel could provide support for European utilities, initially through sentiment and then through revenue and earnings growth, were outlined in the European Commission’s report, A Competitiveness Compass for the EU. In the report, the Commission concludes that Europe “must act now to regain its competitiveness and secure its prosperity.” It cites Europe’s inability to keep pace with other major economies over the past two decades, especially relative to the US in advanced technology owing to a lack of innovation and high regulations.[1] The report outlines key areas of focus and newly instituted acts for the next five years to “reignite economic dynamism,” which we believe will benefit European utilities and other infrastructure companies:
AI Factories Initiative, Q1 2025, and EU Cloud and AI Development Act, Q4 2025-Q1 2026: “Europe needs the computing, cloud and data infrastructures that AI leadership requires…the initiative establishes ‘AI factories’ to boost Europe’s computing power… the Commission will mobilize public and private initiative to establish new AI Gigafactories specialized in training of very large AI models enabling key AI ecosystems throughout the EU.”
Digital Networks Act, Q4 2025: “Closing the innovation gap will require investment in state-of-the-art digital infrastructure, including modern fiber networks, wireless and satellite solutions, investments in 6G and cloud computing capabilities… To correct course, a Digital Networks Act will propose solutions to improve market incentives to build the digital networks of the future.”
Industrial Decarbonization Accelerator Act, Q4 2025, and Electrification Action Plan and European Grids Package, Q1 2026: “This dependence (reliance on fossil fuel for 2/3 of its energy) can only be reduced over time, as a greater share of energy is produced from decarbonized generation in Europe. The EU must thus accelerate the clean energy transition and promote electrification” and “Europe must invest more in modernizing and expanding its network of energy transmission and distribution infrastructure, accelerating investment in electricity, hydrogen and carbon dioxide transport networks as well as storage systems.”
Valuations Favor Europe
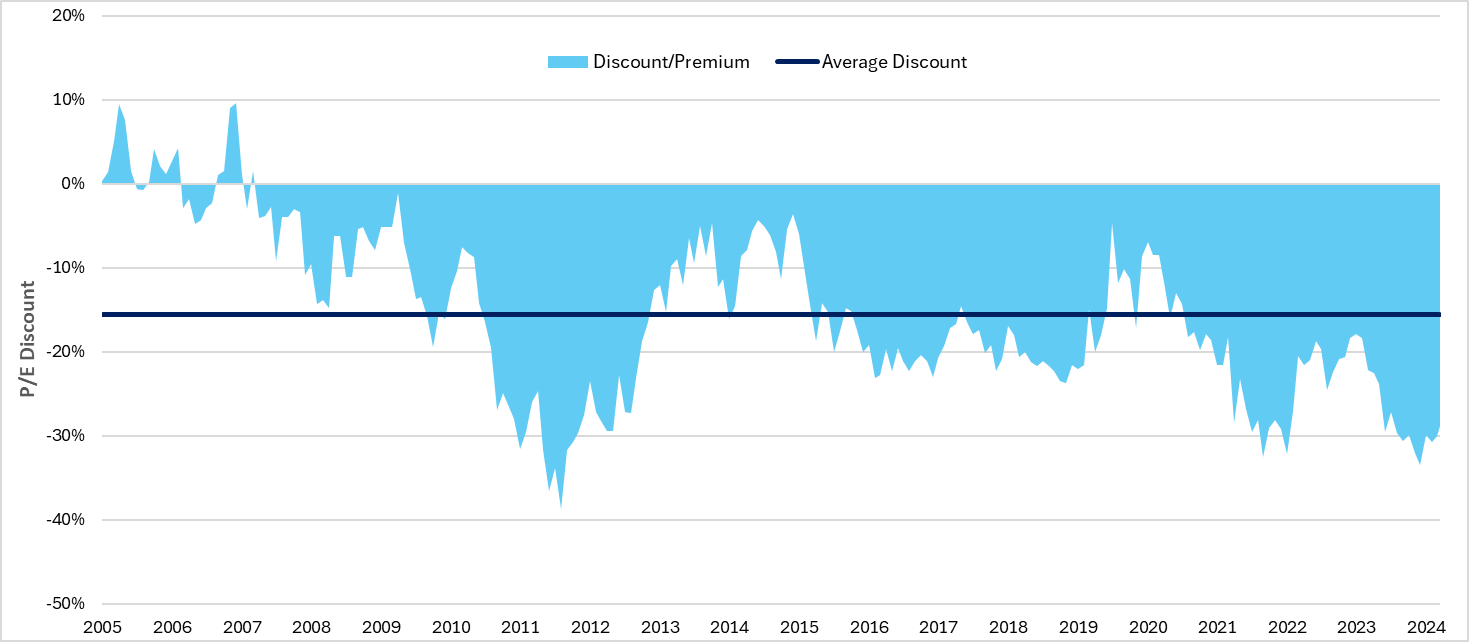
In the past 11 months, price-to-earnings (P/E) ratios of US utilities have rerated by 17% versus 3% for their European counterparts. European utilities currently trade at a 31% P/E discount relative to US utilities, which is more than twice as large as the long-term average of 15%.
European Utilities P/E Discount (-) / Premium (+) Relative to US Utilities
Yield Spreads
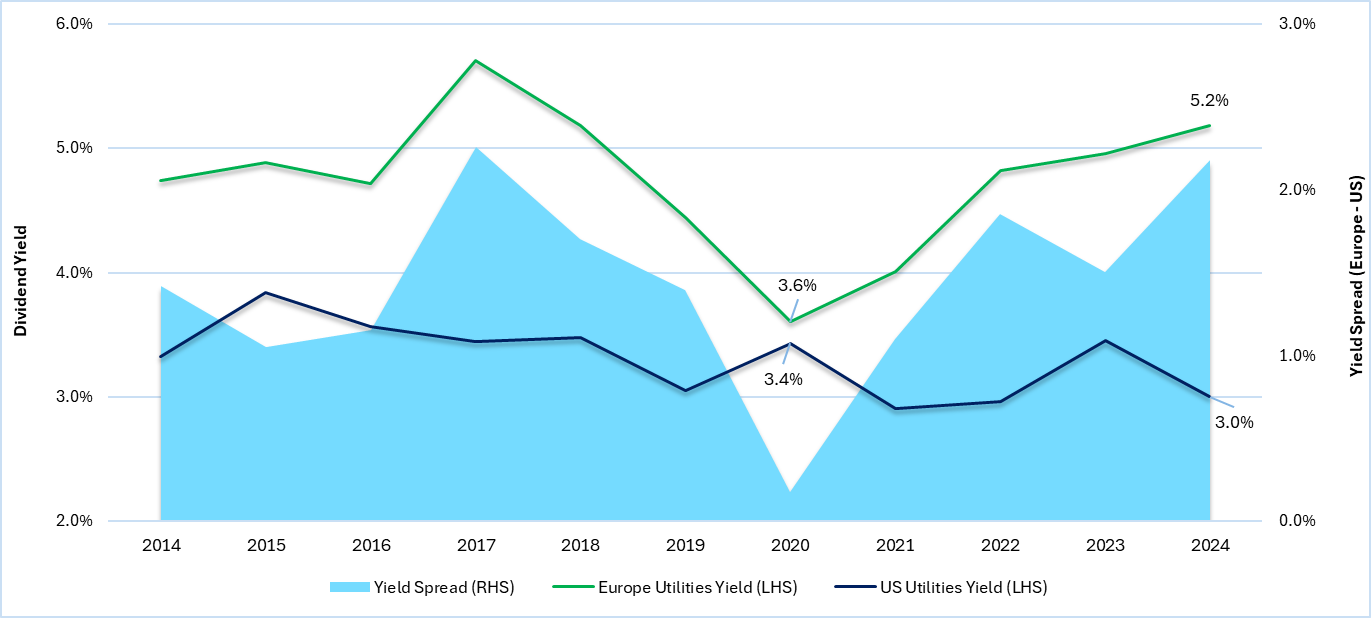
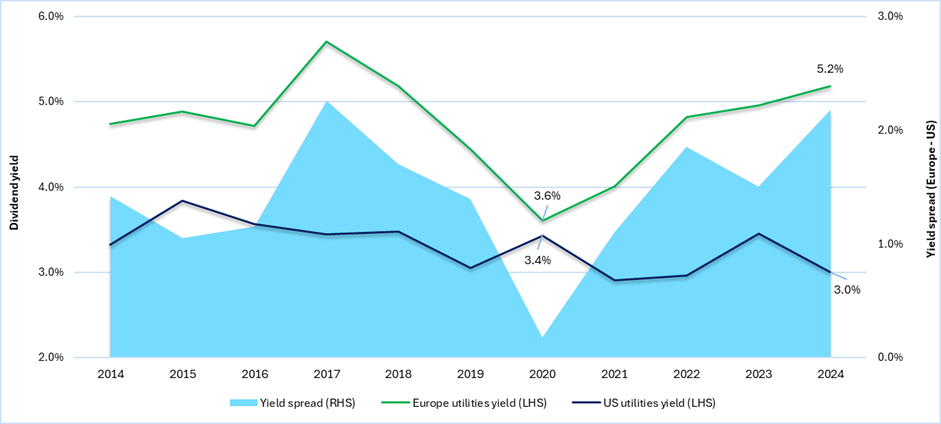
Given the movement in markets, the spread between dividend yields of European and US utilities has moved from 20 basis points (bps) to 220 bps over the past four years, creating opportunities to find promising value investment opportunities in the European utilities sector. This is especially pertinent given the secular tailwinds we expect in the coming year(s), which are identical to the tailwinds that are currently playing out in US markets and driving shares across the infrastructure space.
Dividend Yields and Spread: US vs. Europe
Based on the strength of the US utilities sector driven by the AI power boom, and relative valuations, we have increased our conviction within Europe.
Data Centers Should Create Value
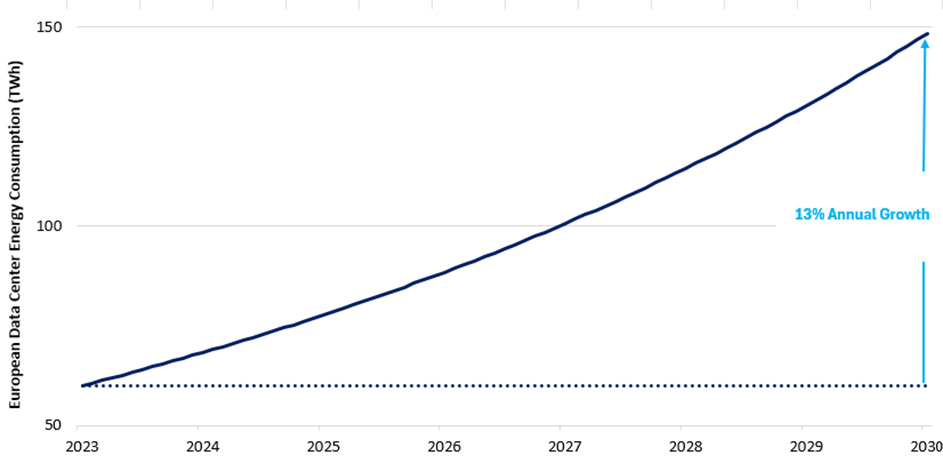
Data-center power demand is surging as the need for greater computing power grows, driven by digitalization, cloud migration and AI. AI is a major contributor to this demand due to its significantly higher power-density requirements stemming from the latest generation of graphics processing unit (GPU) chipsets.
While the growth in data-center build-out may likely be strongest in the US, Europe has ample opportunity to grow its market and further stimulate its technology ecosystem in three key areas:
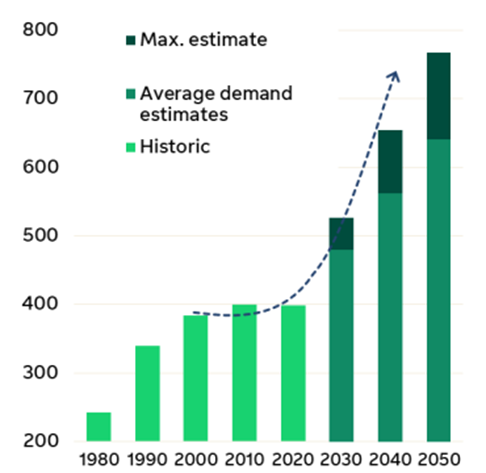
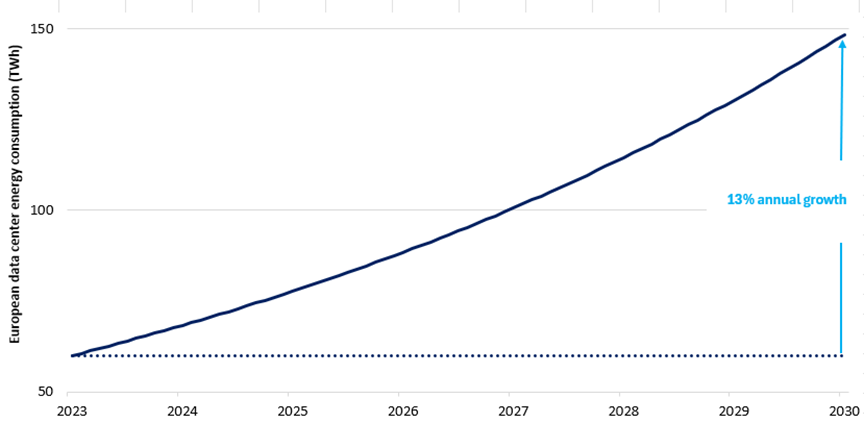
Increased electricity demand: Data centers are likely to drive a significant rise in power consumption, creating long-term revenue growth opportunities for utilities.
Acceleration of green-energy investments: The shift toward sustainability will spur investment in renewable energy, grid modernization and energy storage solutions.
New infrastructure development: Expanding transmission networks and upgrading substations will be necessary, creating opportunities for infrastructure projects.
Power Demand for Data Centers is Projected to Rise Materially in Europe
Utility companies that proactively invest in renewable energy, grid capacity and innovative solutions like demand response and energy storage should be well positioned to capitalize on data-center growth. Strategic partnerships with data-center operators and governments will also be crucial to ensuring a stable and sustainable power supply. The most successful European utilities will likely be those that can balance rapid infrastructure expansion with the transition to renewable energy sources, while navigating complex regulatory environments and managing water resources effectively.
Nordic Countries to Benefit
We believe the Nordic countries (Sweden, Norway, Finland, Denmark and Iceland) are exceptionally well positioned to capitalize on the data-center and AI boom for several compelling reasons.
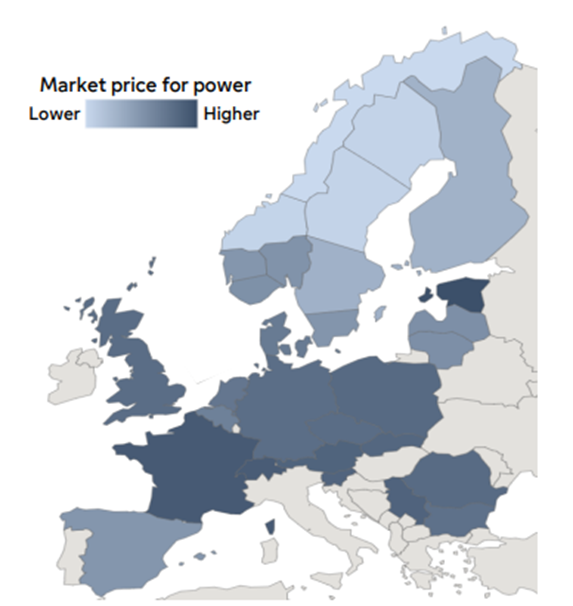
Norway and Sweden have extensive hydropower infrastructure, providing stable, renewable baseload power. Denmark is a leader in wind energy, with offshore wind farms supplying growing portions of its grid. Finland has a diverse energy mix including nuclear, hydro and biomass, which allows data centers to meet their sustainability commitments due to the renewable-rich mix.
The Nordic Region is a Source for Competitive and Clean Energy
Nordic Power Demand is Driven by Decarbonization and Electrification
Cold ambient temperatures for six to eight months of the year dramatically reduce cooling costs, which typically account for 40% of data-center energy consumption. Several facilities in the region use “free cooling” techniques, drawing cold air or water directly from the environment, representing significant operational cost savings compared to facilities in warmer regions.
Strong regulatory frameworks provide assurance for long-term infrastructure investments, and there is low geopolitical risk compared to many other regions. Additionally, transparent business practices as well as strong workforce education levels and technical expertise, contribute to political and economic stability in the region.
The region boasts excellent fiber-optic infrastructure connecting to major European markets and proximity to submarine cable landing stations for international connectivity. Its strategic position linking Europe to North American markets also enhances its connectivity advantage. Sweden’s “Node Pole” region has attracted major investments from US tech companies.
Norway offers low electricity prices, often 50% lower than the EU average, and 98% renewable generation. Finland provides tax incentives specifically for data centers and direct connections to Russian and Baltic markets. Denmark benefits from strong interconnection with the German grid, providing stability. Iceland has unique geothermal energy resources and 100% renewable electricity.
Seeking Greener Pastures
The global economy is increasingly driven by rapid advancements in technology and infrastructure, with AI and data centers at the forefront. As the demand for energy and technological connectivity grows, strategic investments in infrastructure, particularly renewable energy and grid modernization, become crucial. In our view, Europe, with its government support, competitive advantages and commitment to decarbonization, is well positioned to capitalize on these trends.
In our view, utilities and infrastructure companies that embrace innovation and sustainability should thrive in this evolving landscape. The Nordic countries, with their renewable energy resources, favorable climates and regulatory stability, stand out as leaders in this sector. Investors seeking diversification and growth opportunities should consider the potential of European infrastructure, as it offers promising return potential and can contribute to a more resilient future.
In summary, the intersection of technology and infrastructure presents a unique opportunity for growth and innovation. By investing wisely and strategically, Europe can regain its competitive edge and pave the way for a prosperous future.
[1] Source: European Commission, https://commission.europa.eu/document/download/10017eb1-4722-4333-add2-e0ed18105a34_en
Key points
- We believe investors should consider European infrastructure for greater diversification due to favourable valuations and lower exposure to the expensive artificial intelligence (AI) boom in the US.
- Tailwinds for European utilities include government incentives, sector dislocation and rising investment in energy independence.
- Data-centre growth is likely to drive significant power demand, creating long-term revenue growth opportunities for utilities and accelerating green-energy investments.
- The Nordic countries, due to their renewable-energy resources, cold climate and strong regulatory frameworks, are well-positioned to benefit from the data centre and AI boom.
In 2024, we believed there were tailwinds for US utility companies that included significant sector dislocation, government decarbonisation incentives and investments in energy. However, the winds of change are at work once again, with the same drivers now appearing in Europe. We believe that investors should consider greater exposure to European infrastructure.
The death of equity diversification – A decade in review
Global equities have recently hit a series of new all-time highs, as measured by the MSCI World Index, but returns have been led by a handful of large US growth stocks—the ‘magnificent seven’—whose performance has been driven by the promise of future growth from artificial intelligence (AI). These seven stocks have contributed 30% to global equities’ cumulative return of 155% over the past ten years to 31 December 2024, despite comprising only 11% of the benchmark, on average, during the period. The US has contributed 75% of the total returns with an average weight of 56%, while the US information technology sector has contributed 38% of global equity returns, with an average weight of 19%.
Not surprisingly, over the past ten years the US grew from 51% of the global equity market to 65%, while Europe decreased from 22% to 14%. Information technology increased from 14% to 26% of the MSCI World Index while the combined weight of the industrials, utilities, energy and materials sectors fell from 27% to 20%.
The narrowness of the market rally was even more pronounced in the US, where the magnificent seven stocks contributed 29% of the S&P 500® Index’s cumulative 242% return over the ten years through to 31 December 2024. The information technology sector grew from 19% of the S&P 500 to 33% over the same period and contributed 42% of S&P 500’s return despite an average weight of 25%. Together, the weight of the industrials, utilities, energy and materials sectors has fallen from 25% of the S&P 500 ten years ago to 15.5% at the end of 2024. The four infrastructure-exposed sectors started 5% bigger than information technology and ended 17% smaller.
New record highs would suggest that the entire US equity market is expensive. However, lack of market breadth has been the key story of the equity rally. The substantial weighting of these stocks has posed a challenge for investors who rely on the S&P 500 for diversification. Specifically, infrastructure stocks have become notably underrepresented within a typical S&P 500 equity allocation.
We suggest that investors seeking greater diversification should consider the infrastructure sector and specifically should look to European infrastructure where valuations have not been amplified by the expensive AI power boom.
2024 in review
The valuation dispersion between US and European utilities has recently grown. Over the calendar year 2024, the S&P 500 utilities sector has appreciated 27% while European utilities were flat. A key driver of the US appreciation and relative outperformance was the significant capital expenditure of US mega-cap technology companies to support the build-out of the AI ecosystem. These investments in infrastructure, especially related to power, show no signs of stopping. Independent power producers and electric-utilities companies have been among the biggest beneficiaries due to the rising demand for electricity. Hyperscalers’ willingness to secure power at above-market rates also plays a role as they seek to ensure the powering of large data centres in support of their AI aspirations.
So, why do we believe now is a good time to allocate to Europe?
European competitiveness
The key reasons we believe there is opportunity for active managers in European utilities are identical to the reasons we were bullish on the US in 2024:
- Government incentives aimed at decarbonisation can provide tailwinds for renewables-exposed utilities.
- We believe there is a significant sector dislocation in European utilities, potentially unlocking opportunity for active managers.
- We believe electrification and investments in energy independence may continue to drive European electric and gas utilities.
European government support
We believe that infrastructure support for AI is a global goal essential for maintaining competitiveness in leading-edge technology. In addition, due to data privacy concerns, we believe countries will want to control their own technology and data, which will require them to build data centres domestically. Europe has fallen behind technology leaders in the US and China, and European officials have become more vocal about the need to act. In January 2025, the areas we feel could provide support for European utilities, initially through sentiment and then through revenue and earnings growth, were outlined in the European Commission’s report, A Competitiveness Compass for the EU. In the report, the Commission concludes that Europe “must act now to regain its competitiveness and secure its prosperity”. It cites Europe’s inability to keep pace with other major economies over the past two decades, especially relative to the US in advanced technology owing to a lack of innovation and high regulations.[1] The report outlines key areas of focus and newly instituted acts for the next five years to “reignite economic dynamism”, which we believe will benefit European utilities and other infrastructure companies:
AI Factories Initiative, Q1 2025, and EU Cloud and AI Development Act, Q4 2025-Q1 2026: “Europe needs the computing, cloud and data infrastructures that AI leadership requires…the initiative establishes ‘AI factories’ to boost Europe’s computing power… the Commission will mobilise public and private initiative to establish new AI Gigafactories specialised in training of very large AI models enabling key AI ecosystems throughout the EU.”
Digital Networks Act, Q4 2025: “Closing the innovation gap will require investment in state-of-the-art digital infrastructure, including modern fibre networks, wireless and satellite solutions, investments in 6G and cloud computing capabilities… To correct course, a Digital Networks Act will propose solutions to improve market incentives to build the digital networks of the future.”
Industrial Decarbonisation Accelerator Act, Q4 2025, and Electrification Action Plan and European Grids Package, Q1 2026: “This dependence (reliance on fossil fuel for 2/3 of its energy) can only be reduced over time, as a greater share of energy is produced from decarbonised generation in Europe. The EU must thus accelerate the clean energy transition and promote electrification” and “Europe must invest more in modernising and expanding its network of energy transmission and distribution infrastructure, accelerating investment in electricity, hydrogen and carbon dioxide transport networks as well as storage systems.”
Valuations favour Europe
In the past 11 months, price-to-earnings (P/E) ratios of US utilities have rerated by 17% versus 3% for their European counterparts. European utilities currently trade at a 31% P/E discount relative to US utilities, which is more than twice as large as the long-term average of 15%.
European utilities P/E discount (-) /premium (+) relative to US utilities

Yield spreads
Given the movement in markets, the spread between dividend yields of European and US utilities has moved from 20 basis points (bps) to 220 bps over the past four years, creating opportunities to find promising value investment opportunities in the European utilities sector. This is especially pertinent given the secular tailwinds we expect in the coming year(s), which are identical to the tailwinds that are currently playing out in US markets and driving shares across the infrastructure space.
Dividend yields and spread: US versus Europe
Based on the strength of the US utilities sector driven by the AI power boom, and relative valuations, we have increased our conviction within Europe.
Data centres should create value
Data-centre power demand is surging as the need for greater computing power grows, driven by digitalisation, cloud migration and AI. AI is a major contributor to this demand due to its significantly higher power-density requirements stemming from the latest generation of graphics processing unit (GPU) chipsets.
While the growth in data-centre build-out is likely to be strongest in the US, Europe has ample opportunity to grow its market and further stimulate its technology ecosystem in three key areas:
Increased electricity demand: Data centres are likely to drive a significant rise in power consumption, creating long-term revenue growth opportunities for utilities.
Acceleration of green-energy investments: The shift toward sustainability will spur investment in renewable energy, grid modernisation and energy storage solutions.
New infrastructure development: Expanding transmission networks and upgrading substations will be necessary, creating opportunities for infrastructure projects.
Power demand for data centres is projected to rise materially in Europe
Utility companies that proactively invest in renewable energy, grid capacity and innovative solutions like demand response and energy storage should be well positioned to capitalise on data-centre growth. Strategic partnerships with data-centre operators and governments will also be crucial to ensuring a stable and sustainable power supply. The most successful European utilities are likely to be those that can balance rapid infrastructure expansion with the transition to renewable energy sources, while navigating complex regulatory environments and managing water resources effectively.
Nordic countries to benefit
We believe the Nordic countries (Sweden, Norway, Finland, Denmark and Iceland) are exceptionally well positioned to capitalise on the data-centre and AI boom for several compelling reasons.
Norway and Sweden have extensive hydropower infrastructure, providing stable, renewable baseload power. Denmark is a leader in wind energy, with offshore wind farms supplying growing portions of its grid. Finland has a diverse energy mix including nuclear, hydro and biomass, which allows data centres to meet their sustainability commitments due to the renewable-rich mix.
The Nordic region is a source for competitive and clean energy

Nordic power demand is driven by decarbonisation and electrification

Cold ambient temperatures for six to eight months of the year dramatically reduce cooling costs, which typically account for 40% of data-centre energy consumption. Several facilities in the region use ‘free cooling’ techniques, drawing cold air or water directly from the environment, representing significant operational cost savings compared to facilities in warmer regions.
Strong regulatory frameworks provide assurance for long-term infrastructure investments, and there is low geopolitical risk compared to many other regions. Additionally, transparent business practices as well as strong workforce education levels and technical expertise, contribute to political and economic stability in the region.
The region boasts excellent fibre-optic infrastructure connecting to major European markets and proximity to submarine cable landing stations for international connectivity. Its strategic position linking Europe to North American markets also enhances its connectivity advantage. Sweden’s ‘Node Pole’ region has attracted major investments from US tech companies.
Norway offers low electricity prices, often 50% lower than the EU average, and 98% renewable generation. Finland provides tax incentives specifically for data centres and direct connections to Russian and Baltic markets. Denmark benefits from strong interconnection with the German grid, providing stability. Iceland has unique geothermal energy resources and 100% renewable electricity.
Seeking greener pastures
The global economy is increasingly driven by rapid advancements in technology and infrastructure, with AI and data centres at the forefront. As the demand for energy and technological connectivity grows, strategic investments in infrastructure, particularly renewable energy and grid modernisation, become crucial. In our view, Europe, with its government support, competitive advantages and commitment to decarbonisation, is well positioned to capitalise on these trends.
In our view, utilities and infrastructure companies that embrace innovation and sustainability should thrive in this evolving landscape. The Nordic countries, with their renewable energy resources, favourable climates and regulatory stability, stand out as leaders in this sector. Investors seeking diversification and growth opportunities should consider the potential of European infrastructure, as it offers promising return potential and can contribute to a more resilient future.
In summary, the intersection of technology and infrastructure presents a unique opportunity for growth and innovation. By investing wisely and strategically, Europe can regain its competitive edge and pave the way for a prosperous future.
[1] Source: European Commission, https://commission.europa.eu/document/download/10017eb1-4722-4333-add2-e0ed18105a34_en
What’s next for artificial intelligence (AI) and related technologies and how is that affecting your approach?
AI is likely to remain a key area of interest for investors, and we believe the obvious beneficiaries will continue to grow. The critical question is whether this growth will be sufficient to justify current valuations. Unfortunately, we don’t have a crystal ball, but market valuations are stretched. The top ten stocks in the US are trading on a price-to-earnings (P/E) ratio of over 49x, and the ‘magnificent seven’ technology companies represent over 20% of the global market capitalisation.1 In our view, this makes the AI winners vulnerable. With inflation likely to remain higher for longer, keeping bond yields and the discount rate elevated, there is a risk of a derating.
Outside of these market areas, our key focus is to avoid stocks that might be adversely affected by AI, while also identifying perceived losers that could potentially become winners. Additionally, the increased power demand driven by AI should benefit utilities and industrials, while there are segments of the semiconductor supply chain that we believe are attractive from a fundamental, valuation and yield perspective.
Do you believe the global economy is set for a hard or soft landing or a rebound?
The positioning of our Global Equity Income strategy, which is currently overweight consumer staples, utilities, health care and defensive financials, might suggest that we are predicting a hard landing. However, making economic predictions is not central to our investment process, and our multidimensional research, which focuses on long-term themes, fundamentals and stock valuations, indicates that stocks that will benefit from slower economic growth continue to trade at attractive valuations. We would also note that the valuations of stocks listed outside the US have continued to grow more attractive on a relative basis following the US election. This presents a range of opportunities, some defensive and others more cyclical.
Do you believe inflation is likely to tick up again? Should this be a worry for investors?
From a macro perspective, the key theme is ‘great power competition’, which refers to the battle between liberal democracies and autocracies. This competition is encouraging greater localization of manufacturing and protectionism, increased defense spending, rising wages and greater resource nationalization. The upshot is a more inflationary world.
The impact of President-elect Trump’s second administration is difficult to assess, given that we don’t know exactly what policies he will implement. However, the thrust of his agenda does little to change the great power competition backdrop. As a result, we expect a continuation of the ‘higher-for-longer’ inflationary environment.
Predicting where interest rates ultimately settle is challenging, but we can be confident that they will not return to the levels seen following the 2008 global financial crisis. This should not necessarily worry investors. However, the combination of a higher discount rate as a result of higher bond yields and the valuation of growth stocks could well lead to a change in market leadership, similar to that which occurred following the bursting of the last Nasdaq bubble in the late 1990s.
Reassuringly, we believe income stocks are currently inexpensive. As we return to a more normal interest-rate environment, we anticipate a return to a market where the compounding of dividends is once again key to equity-market returns.
How do you think geopolitical issues will play out for investments in 2025?
We expect geopolitical uncertainty to continue to be a big feature of markets and economies in 2025. While we don’t have the same number of elections in the coming year as we have seen in 2024, the results of 2024’s elections will continue to play out. As previously discussed, geopolitics is a key factor in our view that inflation will remain higher for longer. Tariffs, both those applied by the US and in response to it, localization of manufacturing in response to China’s threat to Taiwan, and resource nationalization resulting from international conflict, are all likely to contribute to a more inflationary world.
Where do you currently find the most interesting opportunities?
On a relative basis, we believe that the most interesting opportunities from a regional perspective are across Europe and Asia. Sector-wise, we see the best opportunities in consumer staples, utilities, health care and defensive financials, including insurance companies and exchanges. We are also increasingly seeing opportunities in short cycle and thematic industrials, as well as in specific areas of commodities.
Sources:
1 FactSet, 11/30/24, FTSE World Index
What’s next for artificial intelligence (AI) and related technologies and how is that affecting your approach?
AI is likely to remain a key area of interest for investors, and we believe the obvious beneficiaries will continue to grow. The critical question is whether this growth will be sufficient to justify current valuations. Unfortunately, we don’t have a crystal ball, but market valuations are stretched. The top ten stocks in the US are trading on a price-to-earnings (P/E) ratio of over 49x, and the ‘magnificent seven’ technology companies represent over 20% of the global market capitalisation.1 In our view, this makes the AI winners vulnerable. With inflation likely to remain higher for longer, keeping bond yields and the discount rate elevated, there is a risk of a derating.
Outside of these market areas, our key focus is to avoid stocks that might be adversely affected by AI, while also identifying perceived losers that could potentially become winners. Additionally, the increased power demand driven by AI should benefit utilities and industrials, while there are segments of the semiconductor supply chain that we believe are attractive from a fundamental, valuation and yield perspective.
Do you believe the global economy is set for a hard or soft landing or a rebound?
The positioning of our Global Equity Income strategy, which is currently overweight consumer staples, utilities, health care and defensive financials, might suggest that we are predicting a hard landing. However, making economic predictions is not central to our investment process, and our multidimensional research, which focuses on long-term themes, fundamentals and stock valuations, indicates that stocks that will benefit from slower economic growth continue to trade at attractive valuations. We would also note that the valuations of stocks listed outside the US have continued to grow more attractive on a relative basis following the US election. This presents a range of opportunities, some defensive and others more cyclical.
Do you believe inflation is likely to tick up again? Should this be a worry for investors?
From a macro perspective, the key theme is ‘great power competition’, which refers to the battle between liberal democracies and autocracies. This competition is encouraging greater localisation of manufacturing and protectionism, increased defence spending, rising wages and greater resource nationalisation. The upshot is a more inflationary world.
The impact of President-elect Trump’s second administration is difficult to assess, given that we don’t know exactly what policies he will implement. However, the thrust of his agenda does little to change the great power competition backdrop. As a result, we expect a continuation of the ‘higher-for-longer’ inflationary environment.
Predicting where interest rates ultimately settle is challenging, but we can be confident that they will not return to the levels seen following the 2008 global financial crisis. This should not necessarily worry investors. However, the combination of a higher discount rate as a result of higher bond yields and the valuation of growth stocks could well lead to a change in market leadership, similar to that which occurred following the bursting of the last Nasdaq bubble in the late 1990s.
Reassuringly, we believe income stocks are currently inexpensive. As we return to a more normal interest-rate environment, we anticipate a return to a market where the compounding of dividends is once again key to equity-market returns.
How do you think geopolitical issues will play out for investments in 2025?
We expect geopolitical uncertainty to continue to be a big feature of markets and economies in 2025. While we don’t have the same number of elections in the coming year as we have seen in 2024, the results of 2024’s elections will continue to play out. As previously discussed, geopolitics is a key factor in our view that inflation will remain higher for longer. Tariffs, both those applied by the US and in response to it, localisation of manufacturing in response to China’s threat to Taiwan, and resource nationalisation resulting from international conflict, are all likely to contribute to a more inflationary world.
Where do you currently find the most interesting opportunities?
On a relative basis, we believe that the most interesting opportunities from a regional perspective are across Europe and Asia. Sector-wise, we see the best opportunities in consumer staples, utilities, health care and defensive financials, including insurance companies and exchanges. We are also increasingly seeing opportunities in short cycle and thematic industrials, as well as in specific areas of commodities.
Sources:
1 FactSet, 30/11/24, FTSE World Index
Key points
- Listed infrastructure has delivered a similar risk-reward profile to private infrastructure over the last decade.
- At the end of 2023, listed infrastructure traded at a 30% discount to private infrastructure, the largest discount since 2011, despite its greater liquidity, pricing transparency and ease of access into the asset class.1
- In public markets, investors can get instant access to investment opportunities in infrastructure securities, with the additional benefits of liquidity and pricing transparency.
The investment environment for private infrastructure has been challenging—interest rates are high, private-market multiples are elevated and historical hurdle rates are becoming more difficult to attain. At the same time, infrastructure deals in the private equity space have declined, leaving all-time-high levels of dry powder sitting on the sideline.
In our view, holding private capital reserves could lead to missed opportunities, particularly as infrastructure markets continue to be robust, boosted by tailwinds from deglobalisation, electrification and artificial intelligence (AI), which continue to drive electricity demand and investments. Given this backdrop, we believe now may be an opportune time for infrastructure investors to consider incorporating publicly listed infrastructure into their allocations, as either a complement to, or a substitute for, their unlisted infrastructure investments.
Advantages of listed infrastructure
Both listed and unlisted infrastructure offer investors similar characteristics: yield, capital gains, diversification and inflation-linkage. Separately, listed infrastructure has its own distinct set of advantages, including greater liquidity, readily available access to the market, and real-time pricing transparency. The ability to gain immediate exposure to the asset class can be particularly beneficial in this environment given the declining deal activity and long-term risk/return profiles of private infrastructure. Likewise, pricing transparency can be a key factor for investors in determining the true risks of their portfolios.
In a recent blog discussing the benefits of listed infrastructure, we highlighted the asset class’s relatively stable absolute and risk-adjusted returns throughout market cycles, its ability to pass inflationary pressures on to end consumers, and its stable cash flows that can provide downside support in difficult equity-market environments. Through listed infrastructure, investors can gain immediate beta exposure at lower valuations with greater pricing transparency and liquidity, while potentially earning similar returns.
Similar performance profiles
Up to the end of June 2024, indices tracking both listed and unlisted infrastructure posted a similar annualised return over the trailing ten years—the S&P Global Infrastructure Index (listed infrastructure) rose 4.6%, while the EDHEC Infra300® VW Equity Index (unlisted infrastructure) was up 5.2%, with similar risk (15.5% versus 15.4%, respectively).
With a similar risk/return profile, we believe listed infrastructure could provide a compelling solution for investors wanting exposure to the benefits of infrastructure while maintaining liquidity, pricing transparency and instant access to the asset class.
| Index | 10 Year annualised return | 10 Year standard deviation |
|---|---|---|
| Listed Infrastructure* | 4.6% | 15.5% |
| Private Infrastructure** | 5.2% | 15.4% |
**Source: Infra300 VW USD, Scientific Infra & Private Assets, infra300® 2024Q2 Release, https://publishing.edhecinfra.com/factsheets/Indices/Infra300_Report_2024Q2_Public.pdf.
Market access
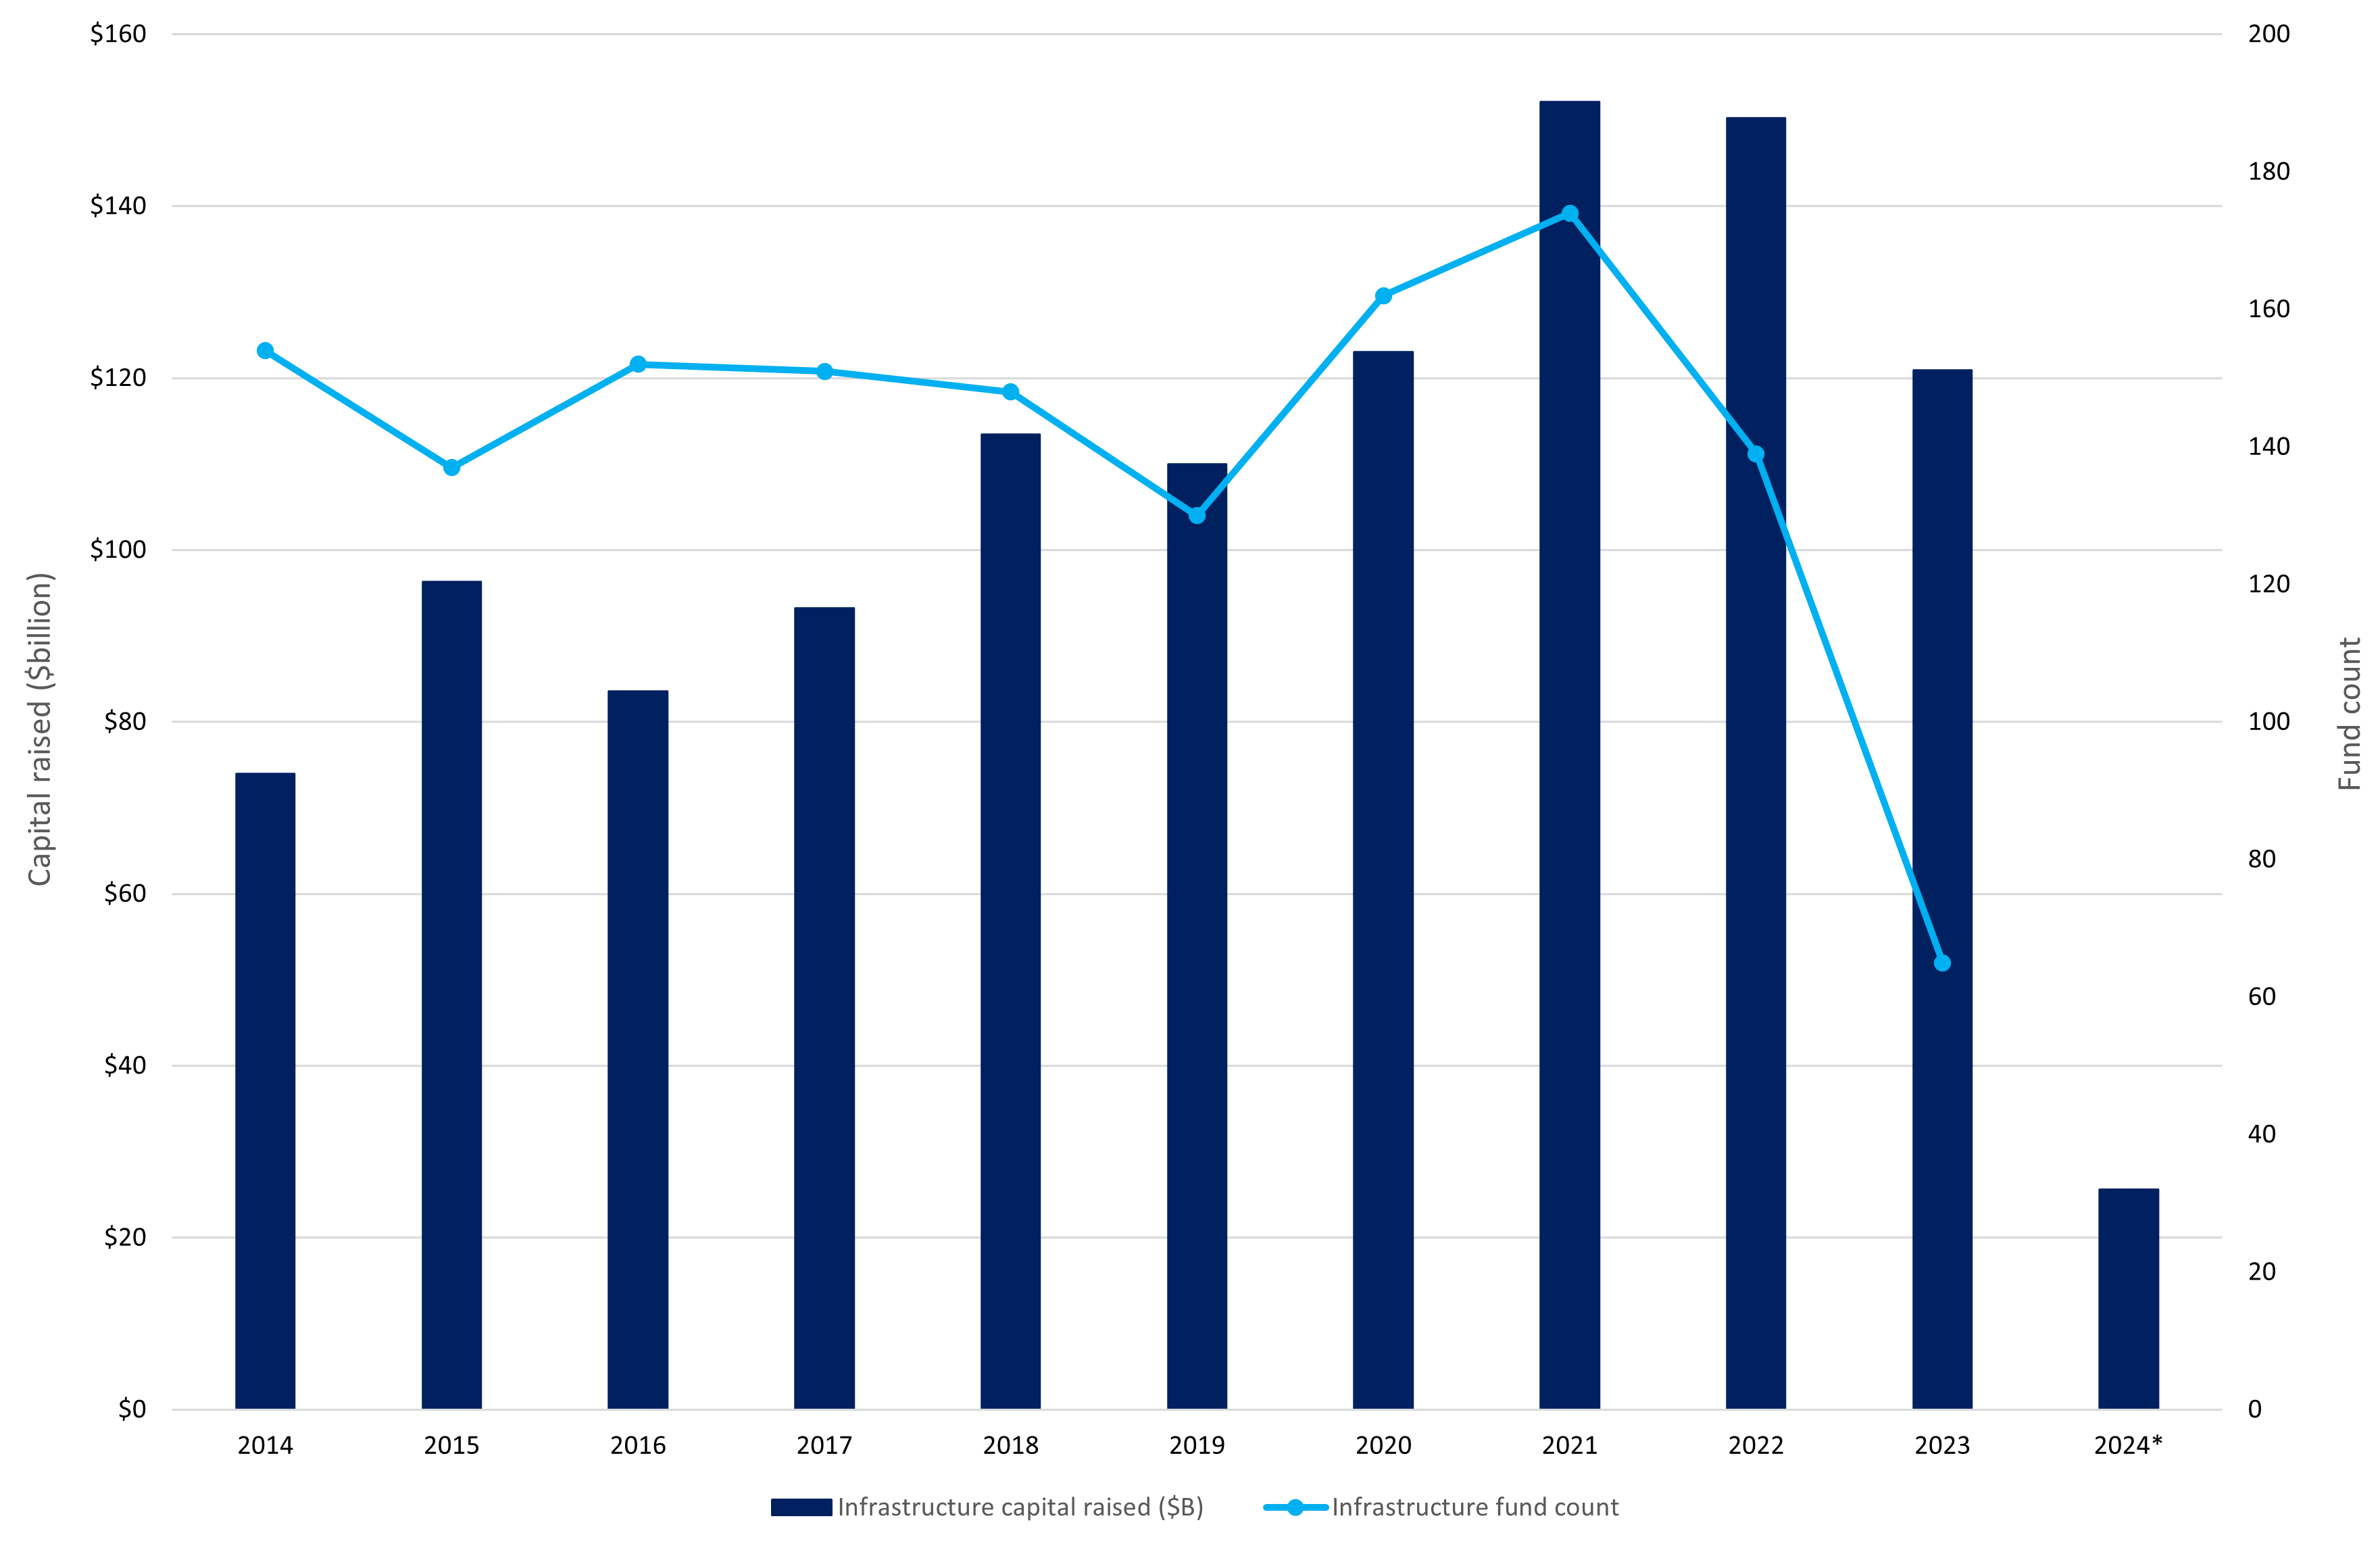
Private infrastructure has recently experienced a significant slowdown in deal activity. In 2023, fundraising dropped by 39.8% year over year and the number of vehicles reaching final close fell to its lowest level since Realfin began tracking in 1990, down 52%. The number of infrastructure deals declined by 18% in 2023 versus the previous year, and infrastructure merger-and-acquisition (M&A) transactions were down 41%.2,3 For committed capital to be deployed, the industry needs new infrastructure projects, new M&As and existing infrastructure to be sold to new buyers. If private infrastructure deal activity continues to lag, investors may struggle to find opportunities for putting their committed capital to work.
Meanwhile, dry powder has nearly tripled in less than a decade. A large sum of the 2020-2022 vintages have yet to be allocated to infrastructure projects, according to PitchBook Data, Inc.4 In our view, there are missed opportunities here, given that infrastructure equities have risen 30% since the end of 2020 (7.5% annualised).5
Infrastructure dry powder ($bn) by vintage

Source: PitchBook Data, Inc. As at 30 September 2023.
The higher interest-rate environment and greater valuation multiples have hindered fresh capital deployment in private infrastructure. Similarly, these challenges have also weighed on the fundraising environment.
Infrastructure fundraising activity
Source: PitchBook Data, Inc. As at 31 March 2024.
In public markets, investors can get instant access to investment opportunities in infrastructure securities, with the additional benefits of liquidity and pricing transparency. In our view, deal activity for existing private infrastructure is likely to remain challenged with record dry powder on the sidelines, owing to the appreciation in private infrastructure valuations over the last decade, combined with higher interest rates. To attract new investors, private infrastructure valuations must compress to listed valuation levels, which would result in lower returns for existing investors. Also, private infrastructure deals for the foreseeable future are likely to be financed at higher interest rates than the deals transacted over the last ten years, which could make historical hurdle rates difficult to attain.
Valuation multiples
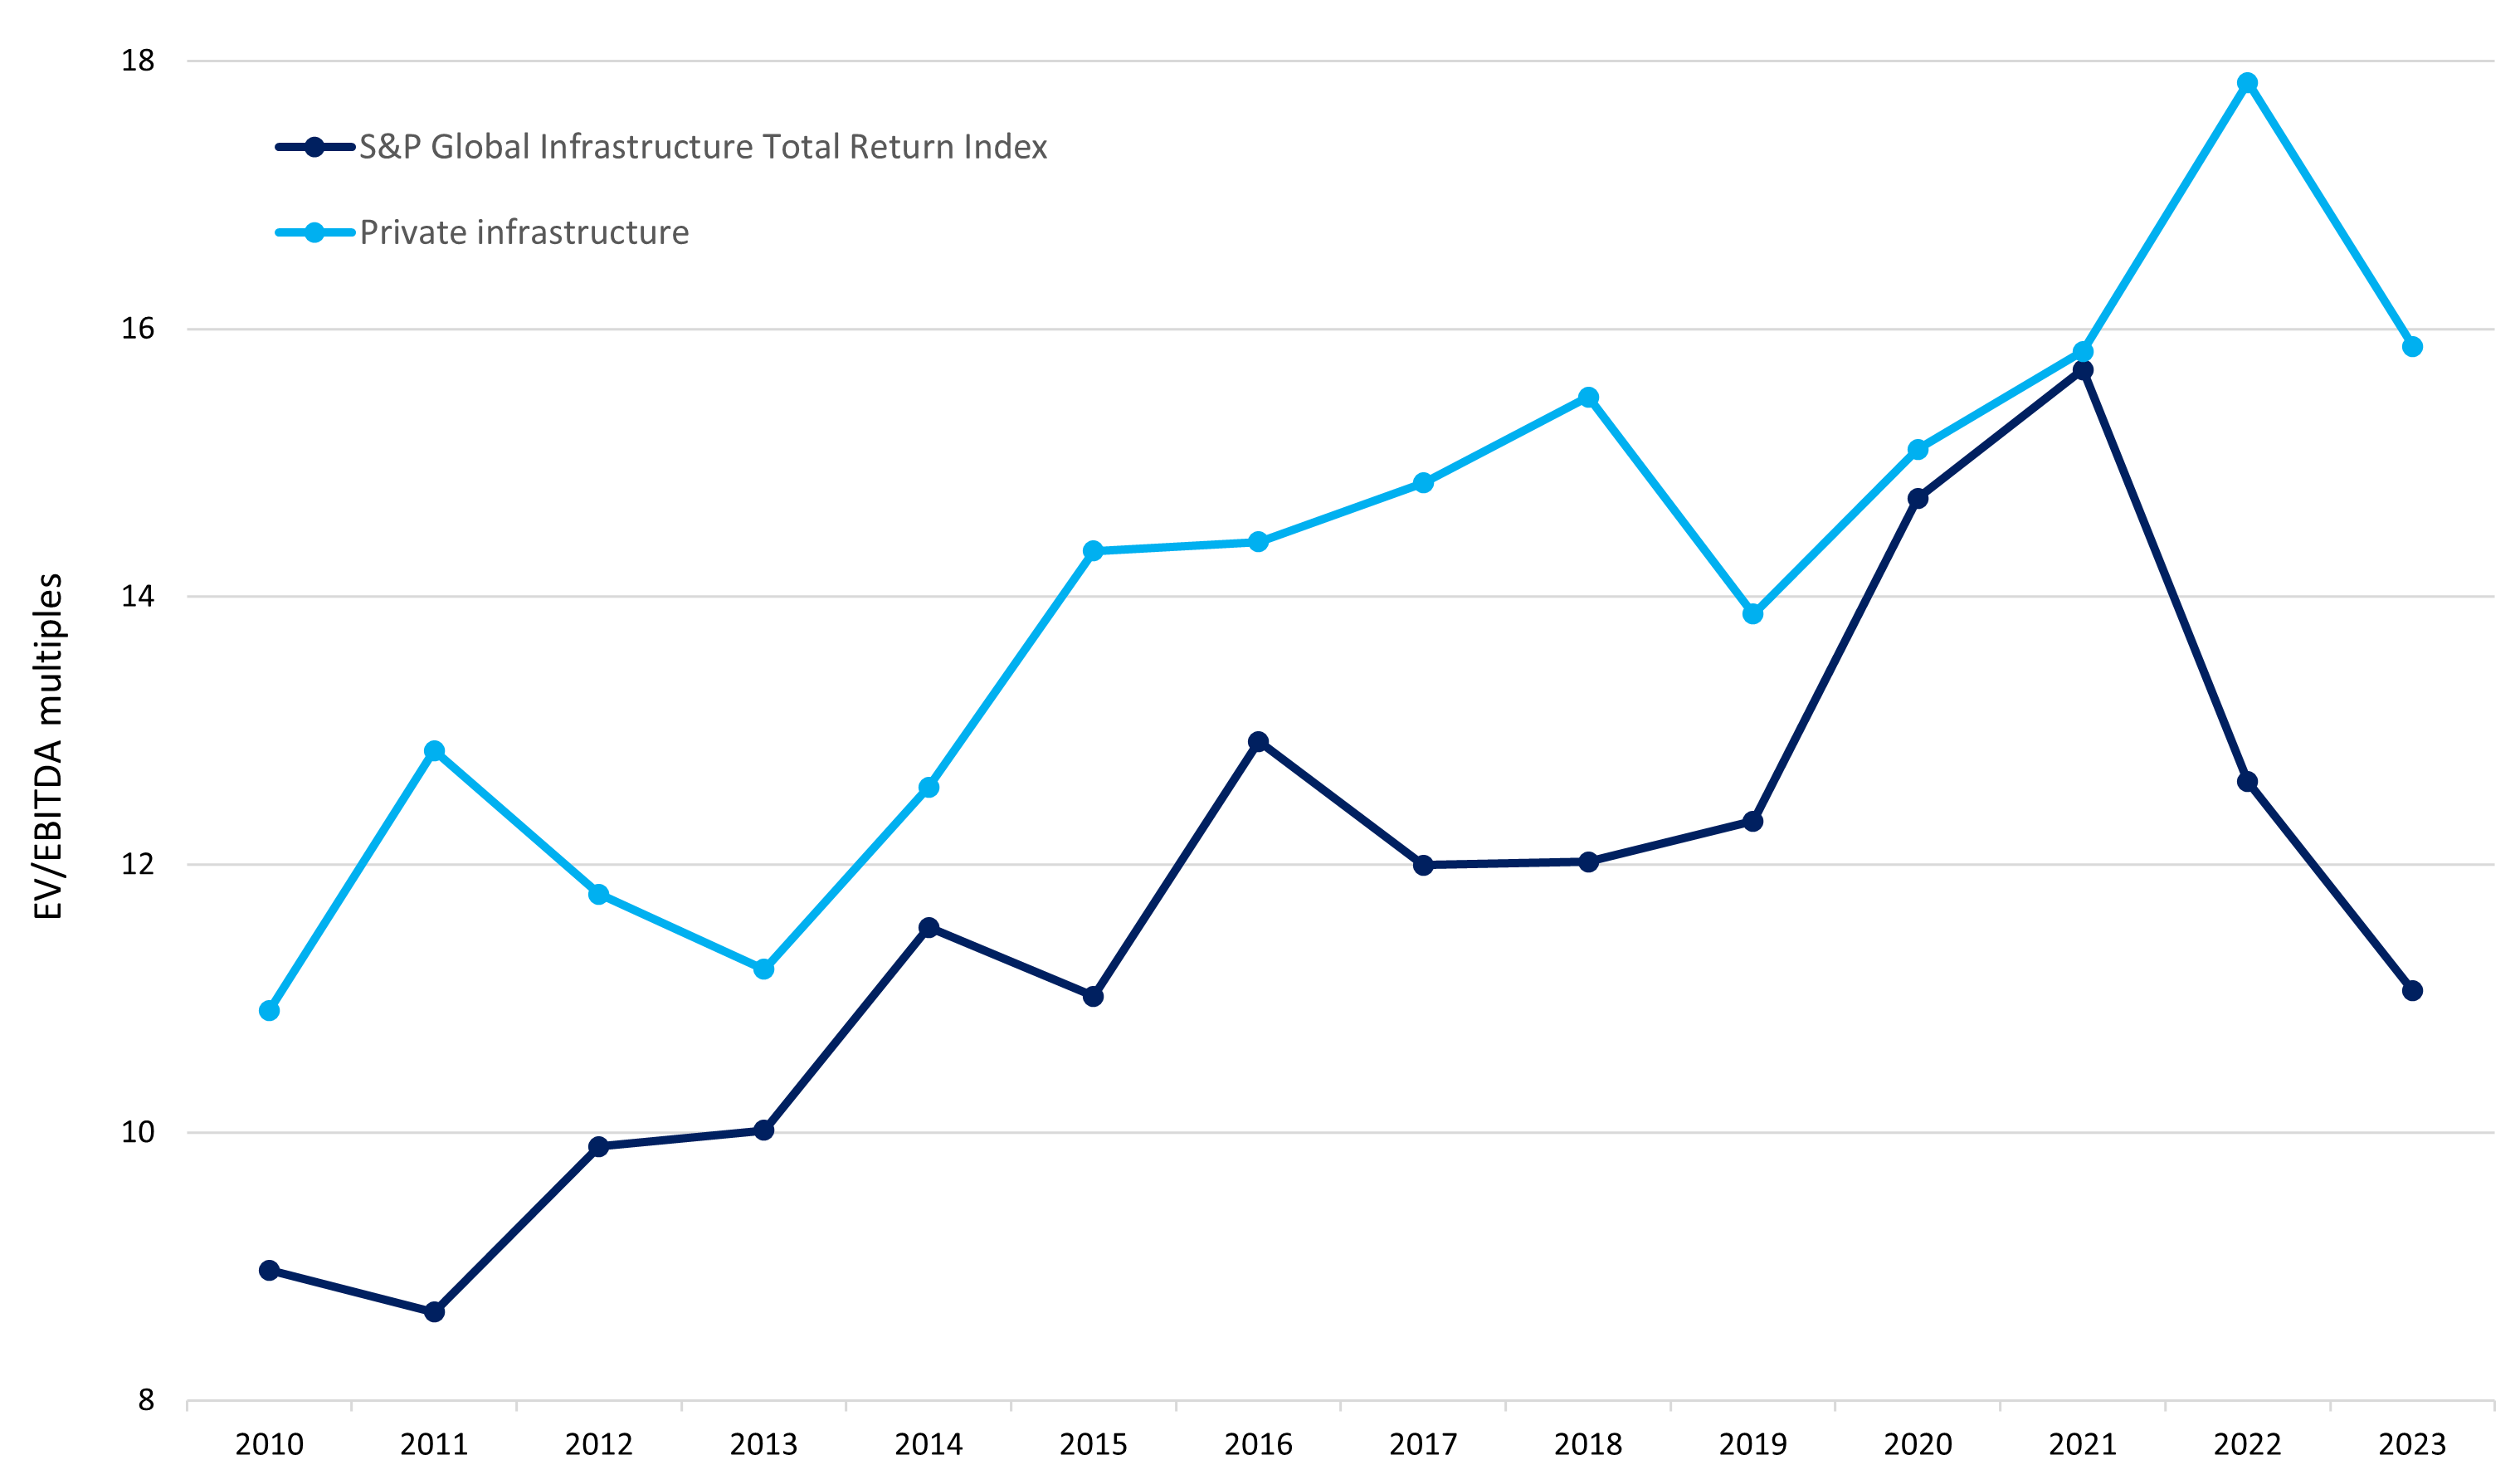
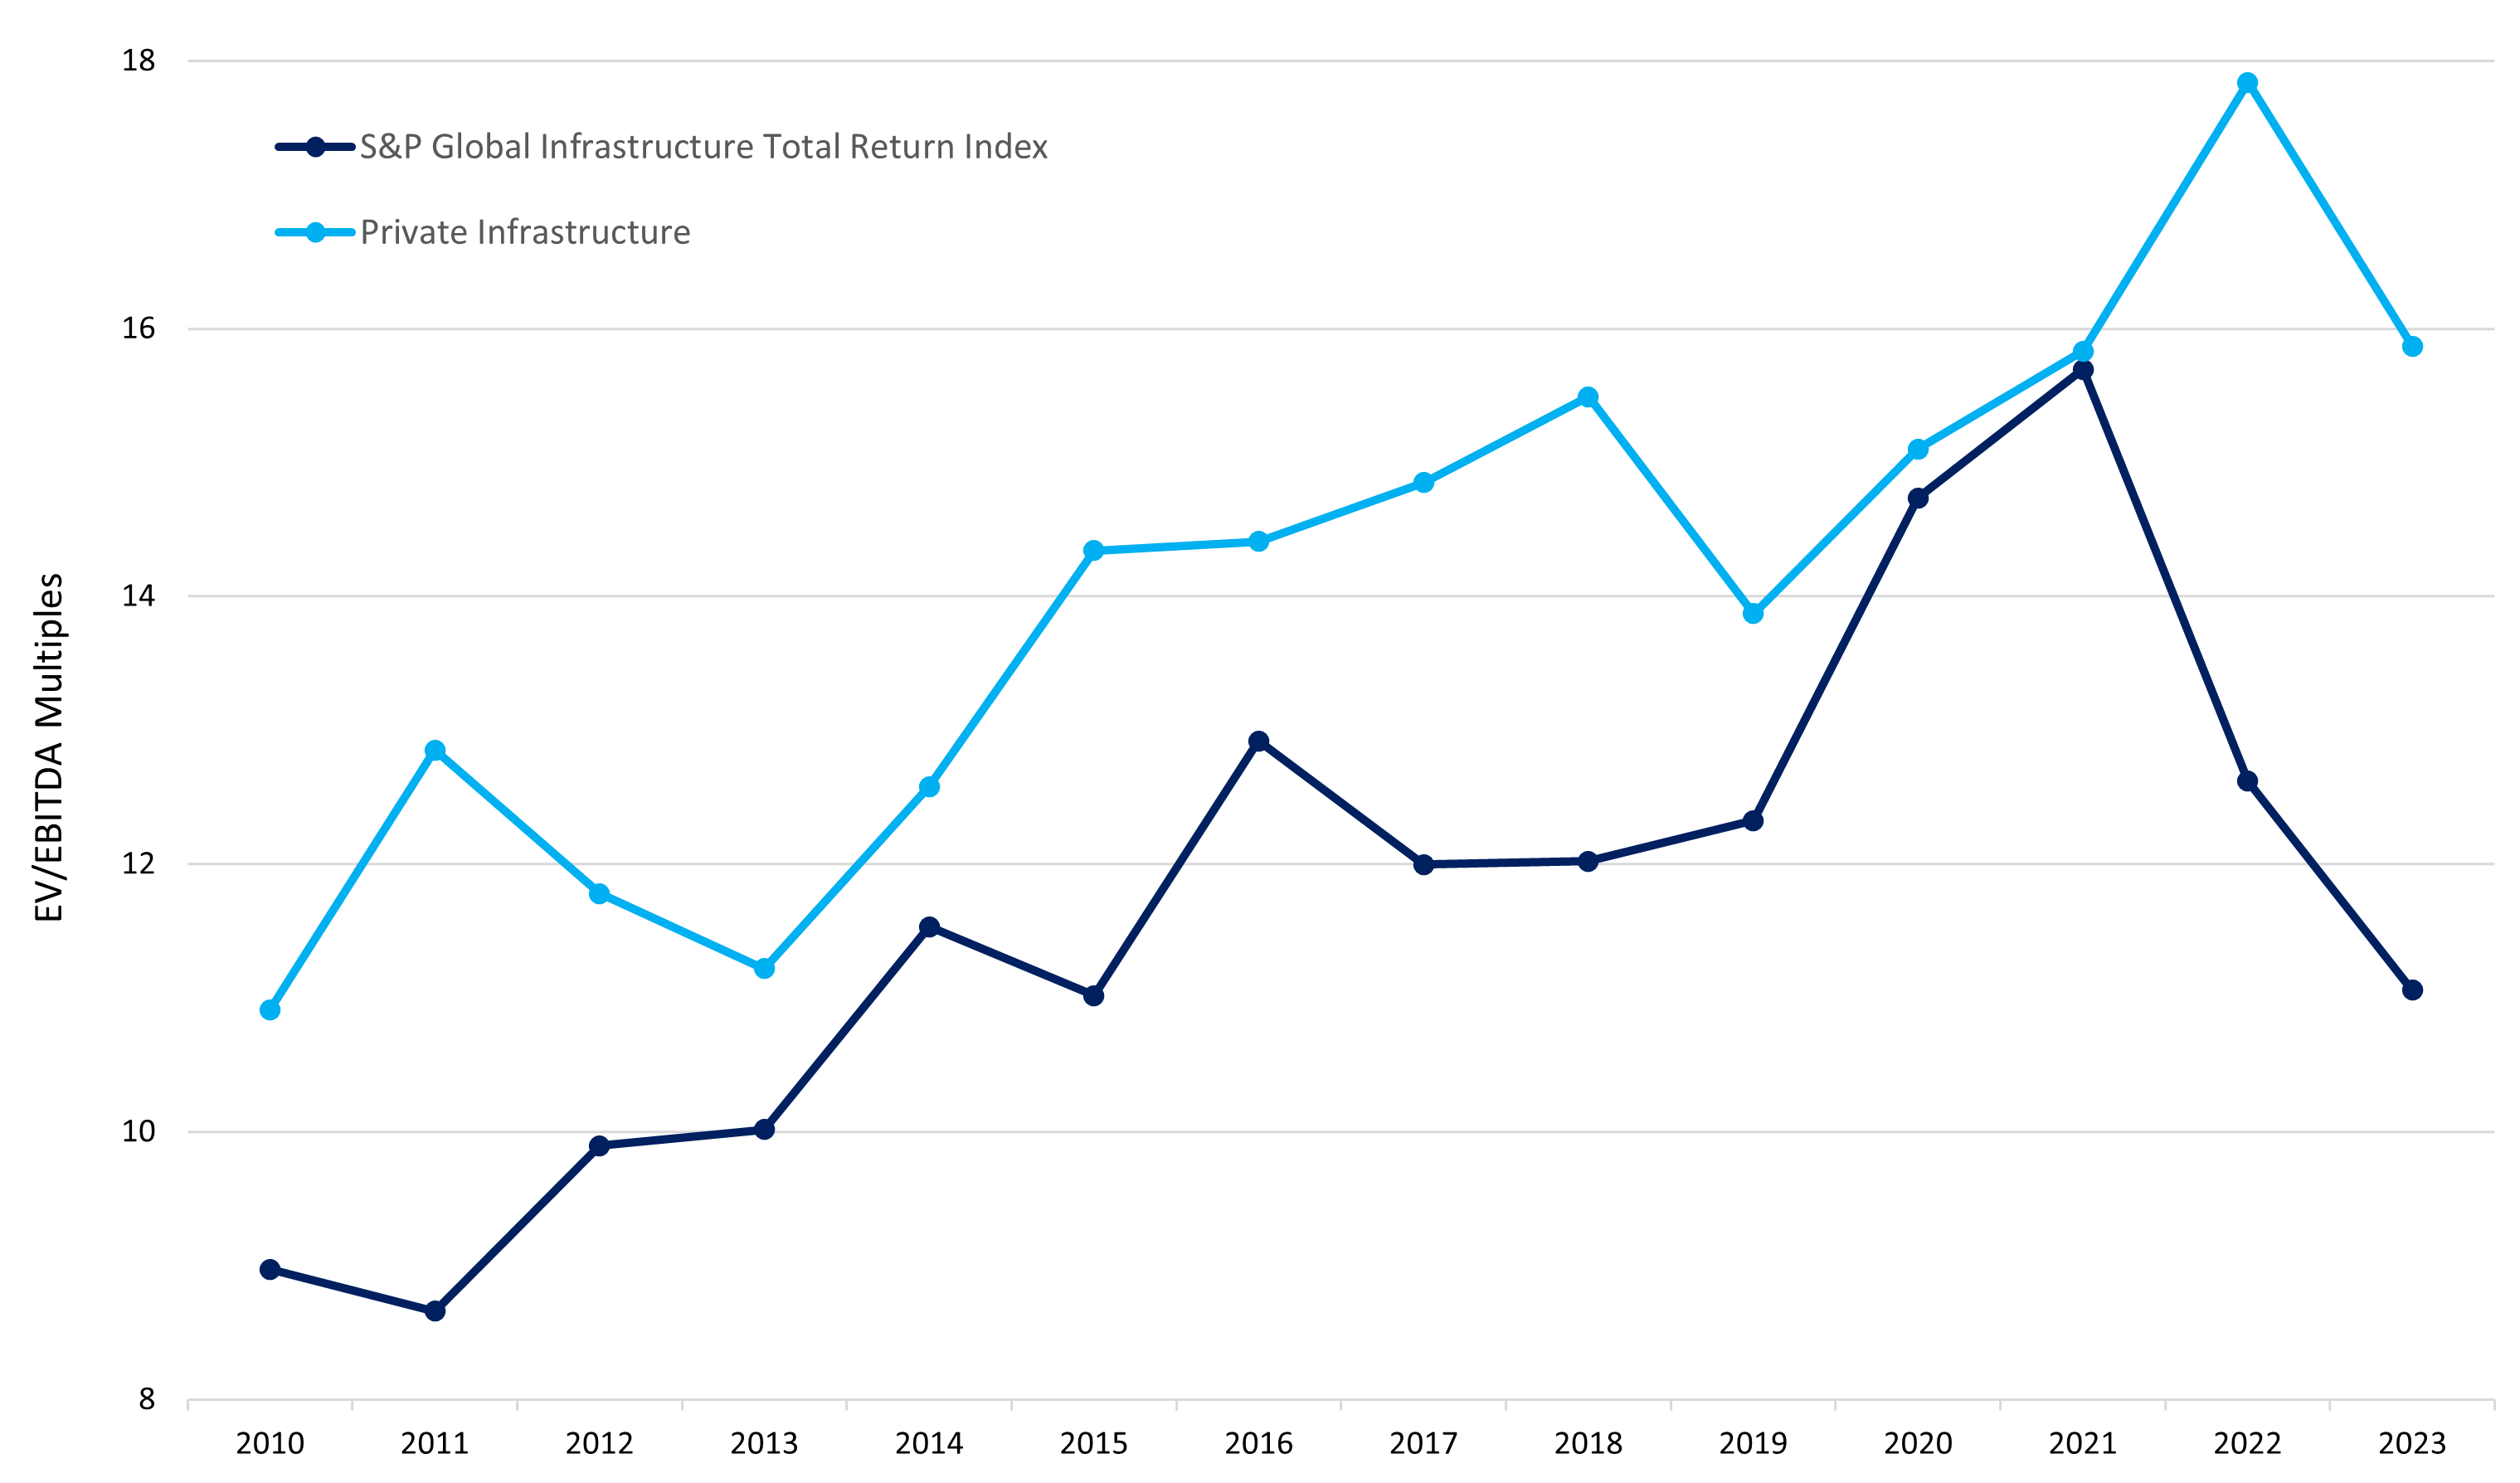
Valuation multiples in private infrastructure began to fall in 2023, partially owing to a downward adjustment in asset owners’ return expectations in the current rate environment. Valuations ended the year with a mean of 15.9 times EV/EBITDA (enterprise value/earnings before interest, taxes, depreciation and amortisation). This is down from 17.8 times in 2022 and closer to the 2018-2022 five-year average of 15.6 times. Realfin predicts a continued downward trend in EV/EBITDA multiples, as “some of these drivers have only just begun exerting their influence on the market.”6 We believe this could lead to continued downward pressure on the return outlook for unlisted infrastructure, which has already fallen from their 2022 highs.
Given its real-time pricing and transparency, we believe listed infrastructure has already factored in the higher rate environment, following a 30% derating from 2021 to 2023; in comparison, private infrastructure experienced an 11% derating from 2022 to 2023. At the end of 2023, listed infrastructure traded at a 30% discount to private infrastructure, the largest discount since 2011, despite its greater liquidity, pricing transparency and ease of access into the asset class.7
Over the last ten-plus years, the market environment was favourable for private infrastructure. Investors could take on leverage at very low rates, buy relatively cheap and exit at higher multiples, as multiples generally rose during this period (from 11 times EV/EBITDA in 2010 to 18 times in 2022).8 However, with higher interest rates (at around 6%), all-time high levels of dry powder, lower transaction activity and higher multiples (at 16 times EV/EBITDA), private infrastructure investors are currently facing a much more difficult environment and may have to lower their return expectations.
In our view, investors who had committed capital sitting on the sidelines over the last three years may have missed out on investing in listed infrastructure. Of the market’s $380 billion in dry powder, approximately 73% was raised from the start of 2021 until 30 September 2023, according to PitchBook Data, Inc.9 The listed infrastructure market has risen 30% from 2021 until July 2024. Given the macroeconomic backdrop, we believe unlisted multiples may continue to decline. At current relative multiples, now could be an opportune time for investors to consider reallocating some of their exposure from unlisted infrastructure to listed infrastructure, to capitalise on the valuation dislocation.
EV/EBITDA multiples
Source: Bloomberg, RealfinX Platform, 31 December 2023.
Liquidity
Whether investors choose to go all in with listed infrastructure or allocate a portion of their infrastructure exposure to the listed market, they may benefit from added liquidity. With dealmaking at a decade low, falling valuation multiples and declining return outlooks, due in part to higher rates, this liquidity provides investors with the opportunity to adjust the duration of their portfolios and access their capital. Furthermore, in these challenging markets, we have seen instances recently of redemption limits being set on private infrastructure assets. In our view, this further underscores the liquidity appeal of publicly listed infrastructure.
Pricing transparency
Valuing unlisted infrastructure can be challenging, as it is difficult to accurately assess the immediate risk/reward profiles of these assets. We have spoken with numerous valuation accountants and auditors who have highlighted that private infrastructure asset owners are afforded more discretion and subjectivity in their reporting, particularly more freedom to take a longer-term view when valuing their assets. This can enable private infrastructure fund managers to immunise their assets from material decreases in valuation. The lack of transparency can cause investors to misinterpret the true risks of private infrastructure assets within their portfolios, as volatility measures may be subdued by opaque and misunderstood valuation guidelines.
On the other hand, listed infrastructure offers real-time transparency with daily mark-to-market valuations, which we believe provide a more accurate depiction of associated risks. This was evident during the Covid-19 pandemic, when publicly listed equities were down over 30% while private benchmarks were down just 10%. As there are very few fundamental differences between the underlying assets of listed and unlisted infrastructure, we would expect them to yield similar results. However, due to the opacity of private infrastructure reporting, including the lack of visibility into the process and massive amounts of discretion afforded to private infrastructure fund managers, private companies were able to smooth out their reported risks.
Reported volatility for listed infrastructure assets may be higher due to daily mark-to-market pricing, full transparency of underlying risks and the inability of fund managers to underplay risks in their reporting. However, we believe that through a full market cycle the true underlying risks and rewards of private and publicly listed infrastructure are very similar, as evidenced by the similar performance profiles of the EDHEC Infra300® VW Equity Index and the S&P Global Infrastructure Index over the last ten years.
Diversifying into listed infrastructure
At Newton, we value the ability to invest in infrastructure with liquidity and pricing transparency. Private market valuations may continue to contract, and this may drag on the return outlook for private infrastructure, particularly relative to the last decade. For these reasons, and given the macroeconomic regime change over the last few years, we believe now may be an opportune time for investors to consider including public infrastructure in their infrastructure allocations. Diversifying into listed infrastructure may allow investors to generate similar returns while more effectively assessing the risk/reward trade-off in their portfolios.
1 RealfinX Platform
2 BCG Global. 18 March 2024. A bump in the road: Private equity infrastructure investment set to rebound following slowdown in 2023. https://www.bcg.com/press/18march2024-private-equity-infrastructure-investment-set-to-rebound.
3 Realfin. Realfin state of the market report global infrastructure 2024. Accessed 26 June 2024. https://realfinprodstorage.blob.core.windows.net/files/2024_Realfin_State_of_Market_Global_Infrastructure_2.1.pdf?utm_source=Newsletter&utm_medium=email&utm_content=Your+requested+link+to+Realfin+State+of+the+Market+-+Global+Infrastructure+2024&utm_campaign=2024-RSOM-INFRA+auto+responder+%28LinkedIn%29&vgo_ee=tYgLHu%2FNcFOMhVXSkAwUbZ2xjW%2F%2FmBpfsftcfiDUixxku8Omw5k%2F51pdRtxq%2F1MK%3AqJkmYXlRoq3Zl9HjWeykIV6YVDQGCKA9.
4 PitchBook. As at 30 September 2023.
5 Bloomberg. Accessed 26 June 2024.
6 Realfin. Private infrastructure multiples cool in 2023. 30 January 2024. https://www.realfin.com/intelligence/private-infrastructure-multiples-cool-in-2023?utm_source=Newsletter&utm_medium=email&utm_content=Private+infrastructure+multiples+cool+in+2023&utm_campaign=2024-01-31+RWIB-INFRA
7 RealfinX Platform
8 RealfinX Platform
9 PitchBook. As at 30 September 2023.
Key Points
- Listed infrastructure has delivered a similar risk-reward profile to private infrastructure over the last decade.
- At the end of 2023, listed infrastructure traded at a 30% discount to private infrastructure, the largest discount since 2011, despite its greater liquidity, pricing transparency and ease of access into the asset class.1
- In public markets, investors can get instant access to investment opportunities in infrastructure securities, with the additional benefits of liquidity and pricing transparency.
The investment environment for private infrastructure has been challenging—interest rates are high, private-market multiples are elevated and historical hurdle rates are becoming more difficult to attain. At the same time, infrastructure deals in the private equity space have declined, leaving all-time-high levels of dry powder sitting on the sideline.
In our view, holding private capital reserves could lead to missed opportunities, particularly as infrastructure markets continue to be robust, boosted by tailwinds from deglobalization, electrification and artificial intelligence (AI), which continue to drive electricity demand and investments. Given this backdrop, we believe now may be an opportune time for infrastructure investors to consider incorporating publicly listed infrastructure into their allocations, as either a complement to, or a substitute for, their unlisted infrastructure investments.
Advantages of Listed Infrastructure
Both listed and unlisted infrastructure offer investors similar characteristics: yield, capital gains, diversification and inflation-linkage. Separately, listed infrastructure has its own distinct set of advantages, including greater liquidity, readily available access to the market, and real-time pricing transparency. The ability to gain immediate exposure to the asset class can be particularly beneficial in this environment given the declining deal activity and long-term risk/return profiles of private infrastructure. Likewise, pricing transparency can be a key factor for investors in determining the true risks of their portfolios.
In a recent blog discussing the benefits of listed infrastructure, we highlighted the asset class’s relatively stable absolute and risk-adjusted returns throughout market cycles, its ability to pass inflationary pressures on to end consumers, and its stable cash flows that can provide downside support in difficult equity-market environments. Through listed infrastructure, investors can gain immediate beta exposure at lower valuations with greater pricing transparency and liquidity, while potentially earning similar returns.
Similar Performance Profiles
Through June 2024, indices tracking both listed and unlisted infrastructure posted a similar annualized return over the trailing ten years—the S&P Global Infrastructure Index (listed infrastructure) rose 4.6%, while the EDHEC Infra300® VW Equity Index (unlisted infrastructure) was up 5.2%, with similar risk (15.5% versus 15.4%, respectively).
With a similar risk/return profile, we believe listed infrastructure could provide a compelling solution for investors wanting exposure to the benefits of infrastructure while maintaining liquidity, pricing transparency and instant access to the asset class.
| Index | 10 Year Annualized Return | 10 Year Standard Deviation |
|---|---|---|
| Listed Infrastructure* | 4.6% | 15.5% |
| Private Infrastructure** | 5.2% | 15.4% |
**Source: Infra300 VW USD, Scientific Infra & Private Assets, infra300® 2024Q2 Release, https://publishing.edhecinfra.com/factsheets/Indices/Infra300_Report_2024Q2_Public.pdf.
Through listed infrastructure, investors can gain immediate beta exposure at lower valuations with greater pricing transparency and liquidity, while potentially earning similar returns.
Market Access
Private infrastructure has recently experienced a significant slowdown in deal activity. In 2023, fundraising dropped by 39.8% year over year and the number of vehicles reaching final close fell to its lowest level since Realfin began tracking in 1990, down 52%. The number of infrastructure deals declined by 18% in 2023 versus the previous year, and infrastructure merger-and-acquisition (M&A) transactions were down 41%.2,3 For committed capital to be deployed, the industry needs new infrastructure projects, new M&As and existing infrastructure to be sold to new buyers. If private infrastructure deal activity continues to lag, investors may struggle to find opportunities for putting their committed capital to work.
Meanwhile, dry powder has nearly tripled in less than a decade. A large sum of the 2020-2022 vintages have yet to be allocated to infrastructure projects, according to PitchBook Data, Inc.4 In our view, there are missed opportunities here, given that infrastructure equities have risen 30% since the end of 2020 (7.5% annualized).5
Infrastructure Dry Powder ($bn) by Vintage
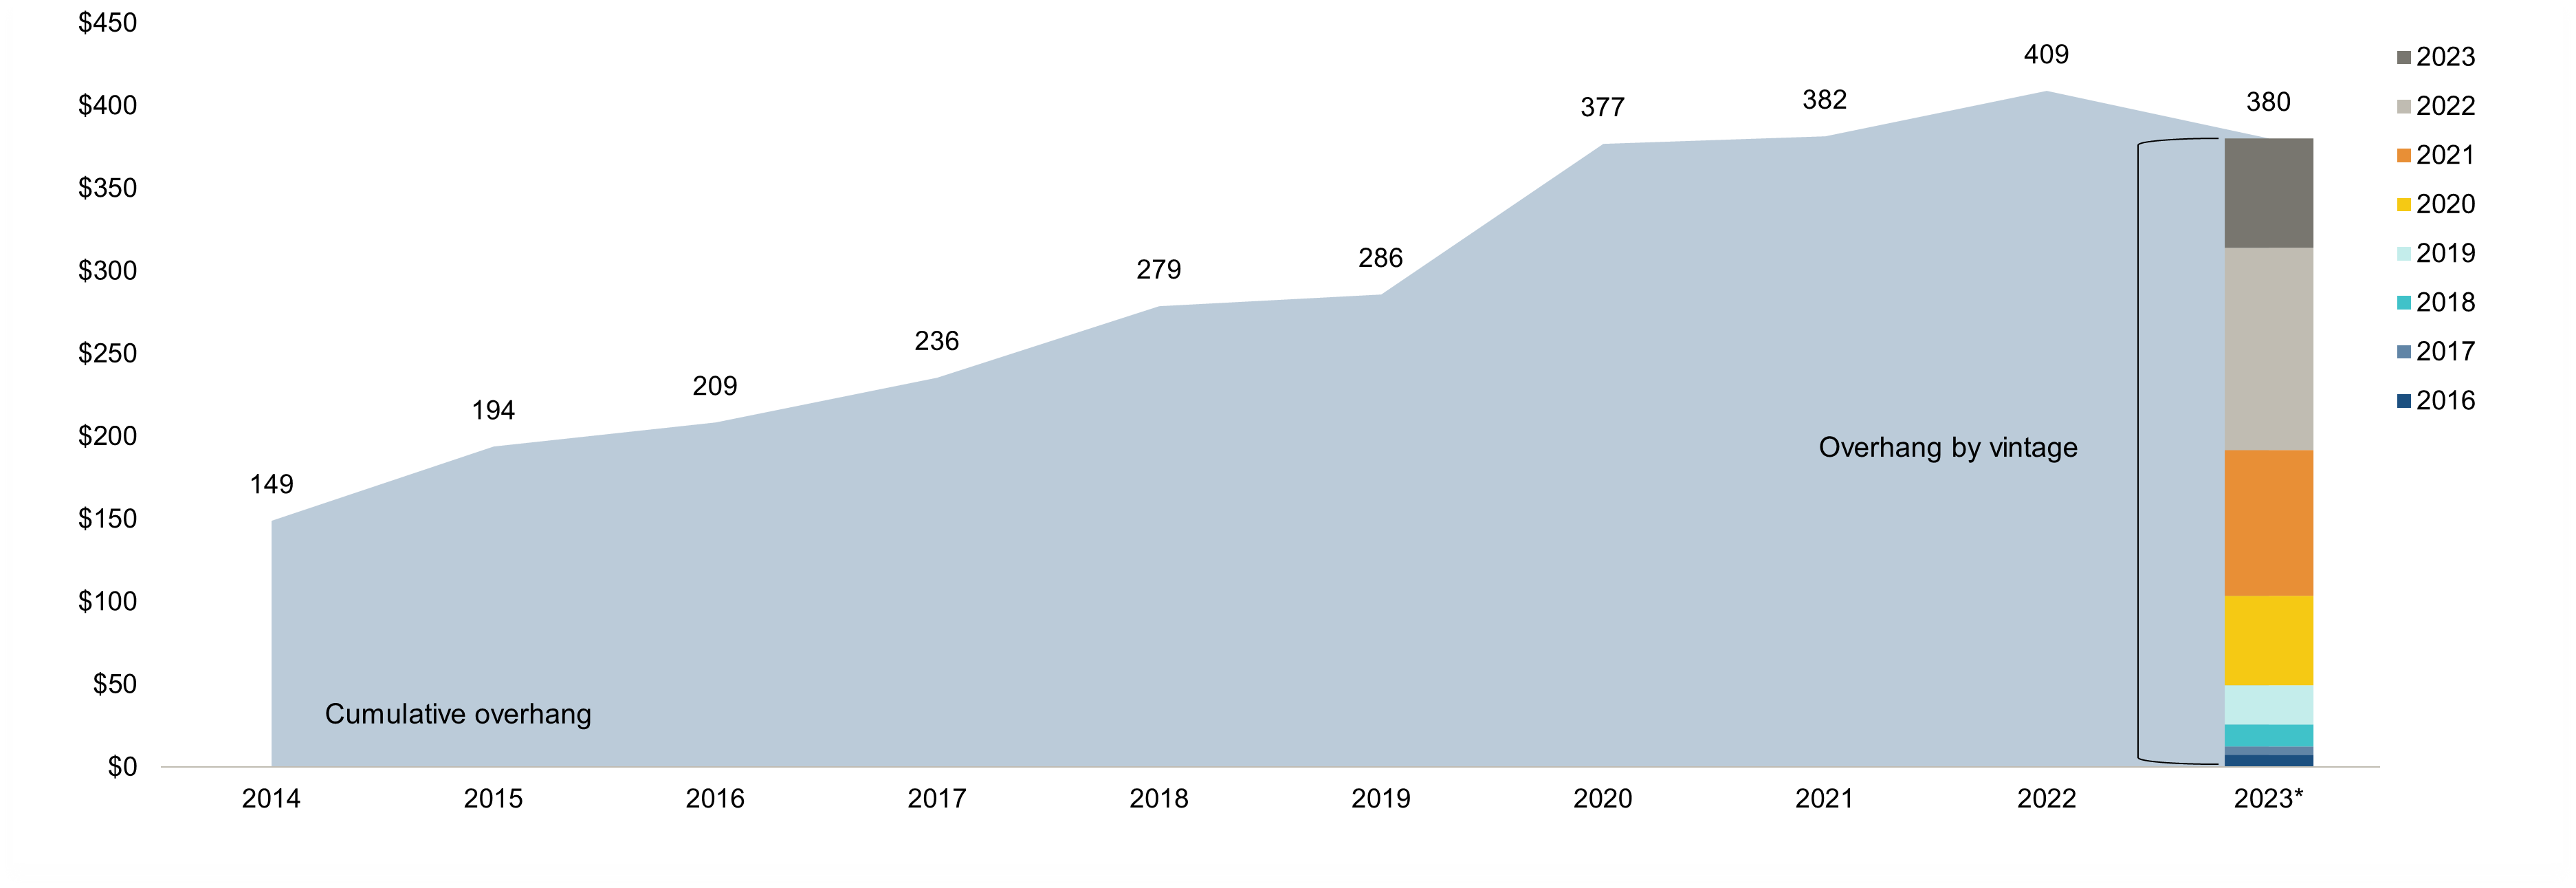
Source: PitchBook Data, Inc. As of September 30, 2023.
The higher interest-rate environment and greater valuation multiples have hindered fresh capital deployment in private infrastructure. Similarly, these challenges have also weighed on the fundraising environment.
Infrastructure Fundraising Activity
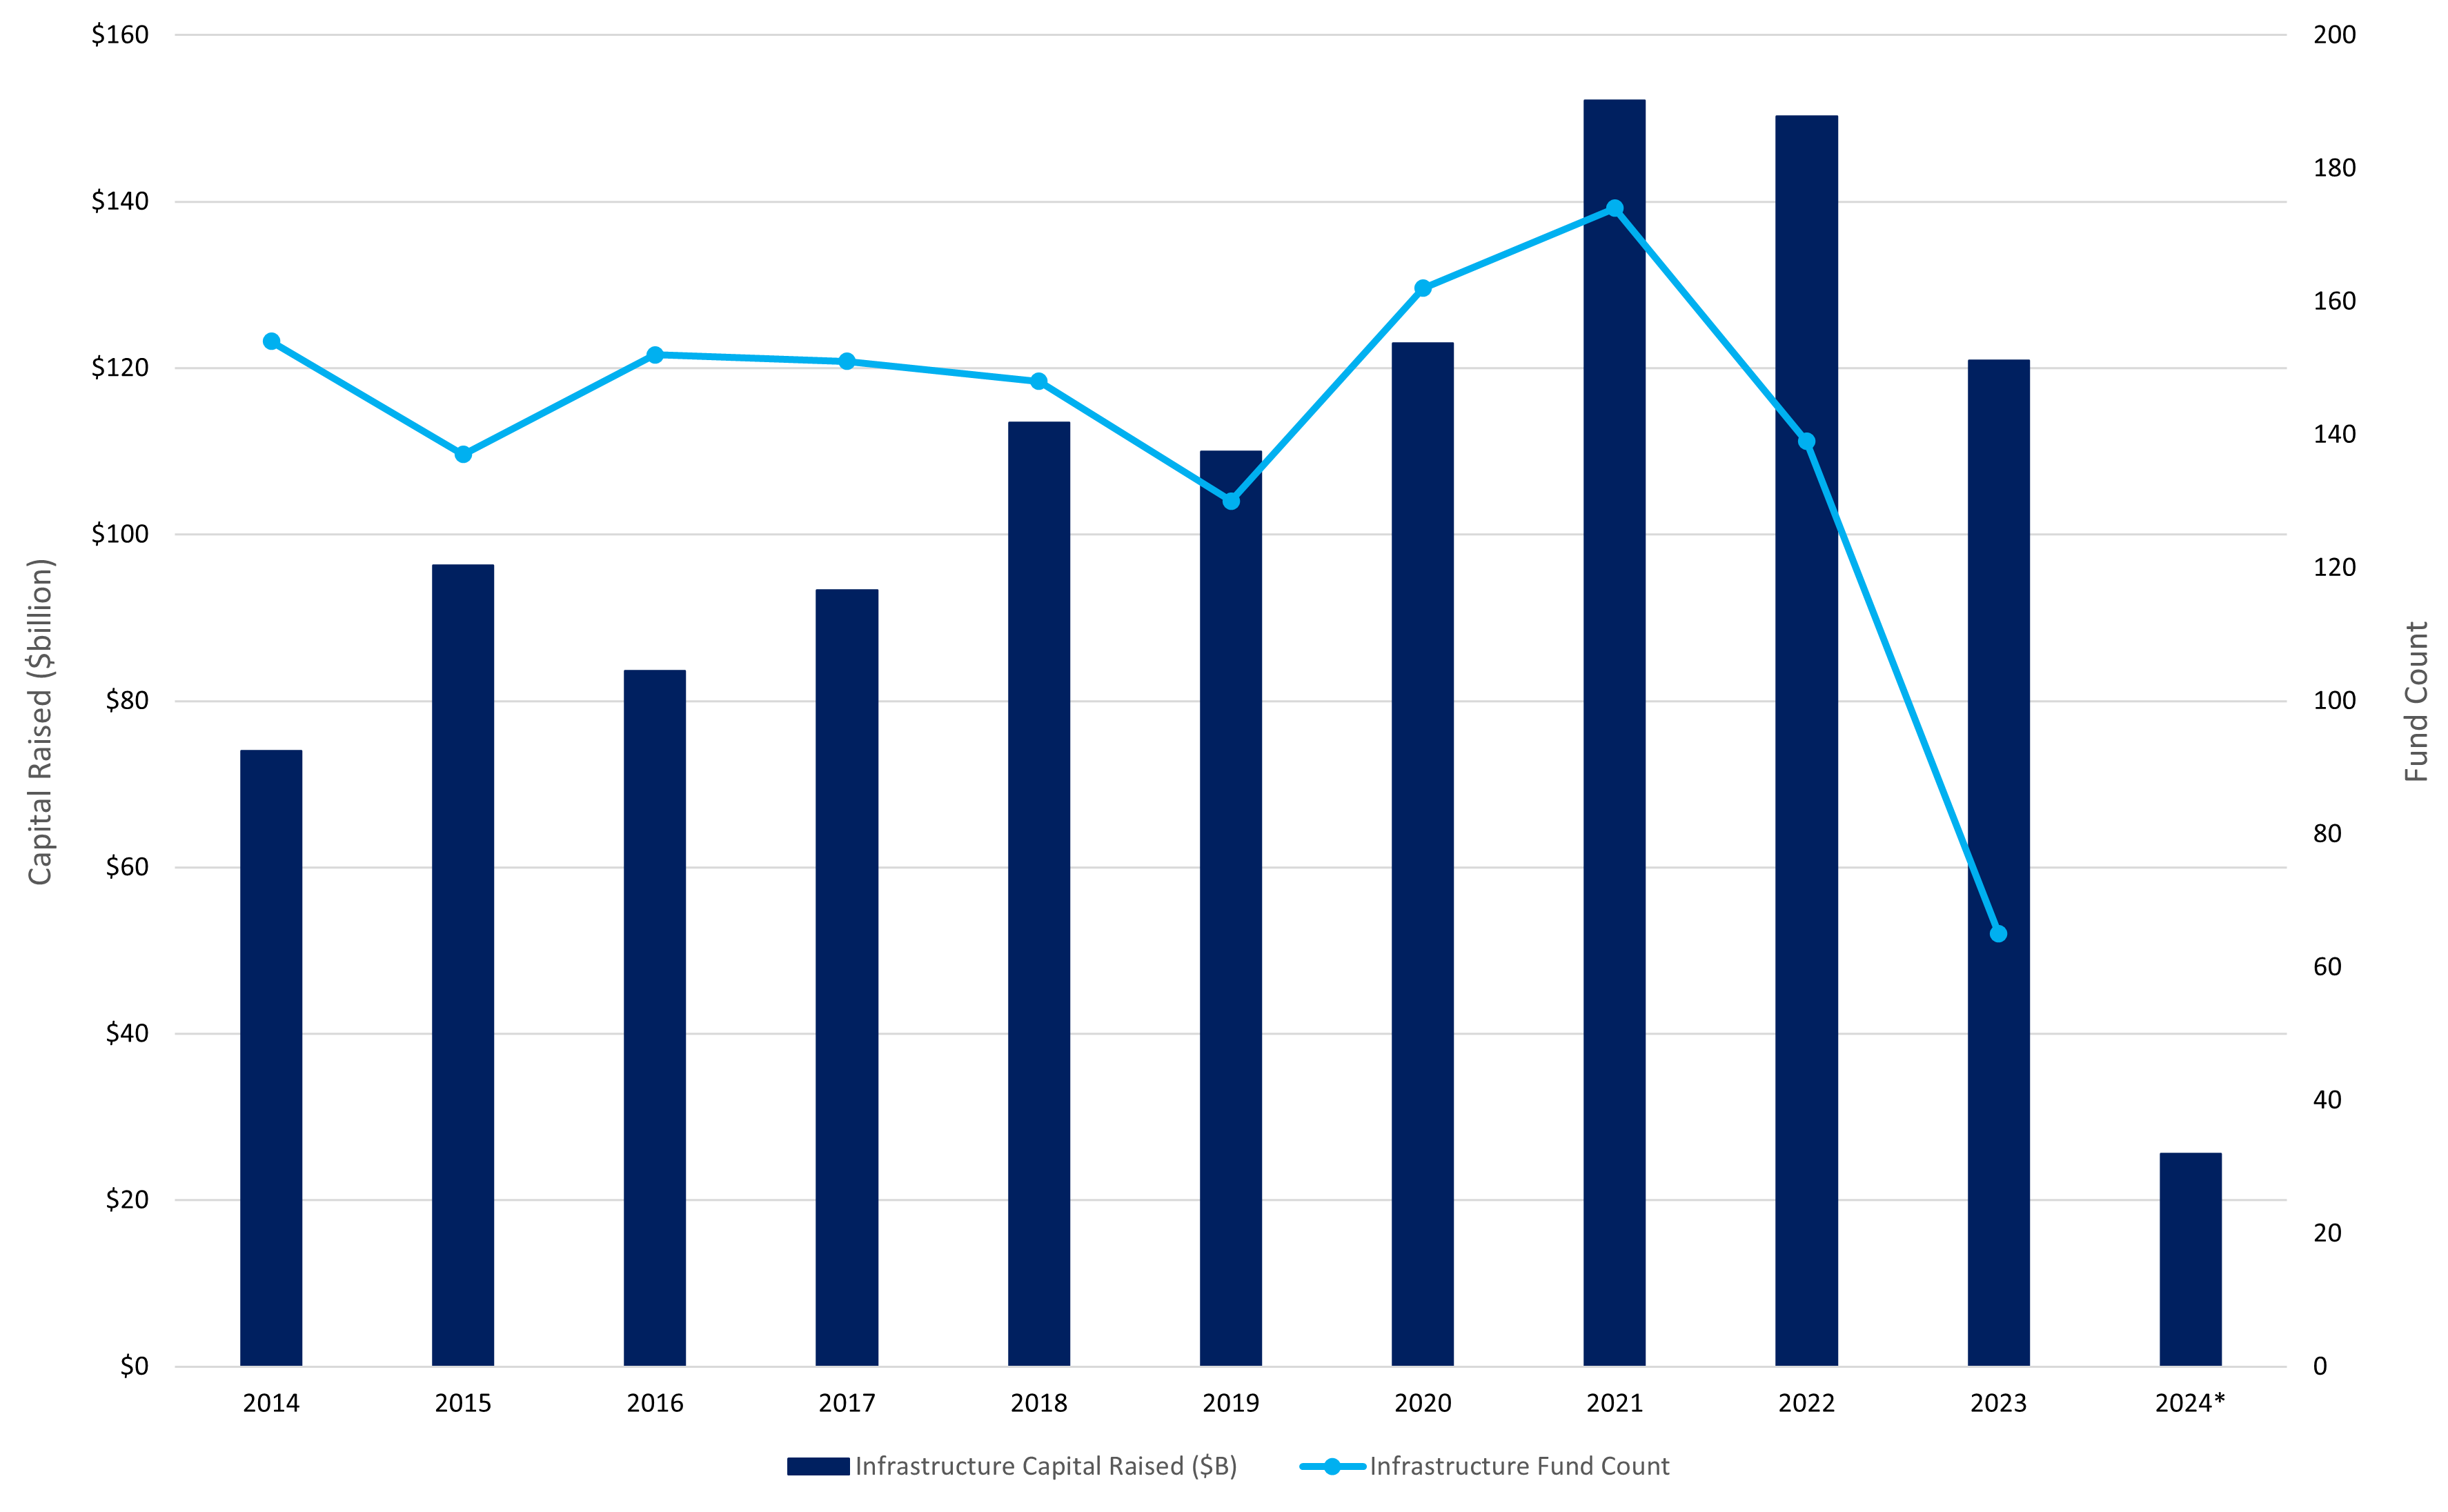
Source: PitchBook Data, Inc. *As of March 31, 2024.
In public markets, investors can get instant access to investment opportunities in infrastructure securities, with the additional benefits of liquidity and pricing transparency. In our view, deal activity for existing private infrastructure is likely to remain challenged with record dry powder on the sidelines, owing to the appreciation in private infrastructure valuations over the last decade, combined with higher interest rates. To attract new investors, private infrastructure valuations must compress to listed valuation levels, which would result in lower returns for existing investors. Also, private infrastructure deals for the foreseeable future are likely to be financed at higher interest rates than the deals transacted over the last ten years, which could make historical hurdle rates difficult to attain.
Valuation Multiples
Valuation multiples in private infrastructure began to fall in 2023, partially owing to a downward adjustment in asset owners’ return expectations in the current rate environment. Valuations ended the year with a mean of 15.9 times EV/EBITDA (enterprise value/earnings before interest, taxes, depreciation and amortization). This is down from 17.8 times in 2022 and closer to the 2018-2022 five-year average of 15.6 times. Realfin predicts a continued downward trend in EV/EBITDA multiples, as “some of these drivers have only just begun exerting their influence on the market.”6 We believe this could lead to continued downward pressure on the return outlook for unlisted infrastructure, which has already fallen from their 2022 highs.
Given its real-time pricing and transparency, we believe listed infrastructure has already factored in the higher rate environment, following a 30% derating from 2021 through 2023; in comparison, private infrastructure experienced an 11% derating from 2022 to 2023. At the end of 2023, listed infrastructure traded at a 30% discount to private infrastructure, the largest discount since 2011, despite its greater liquidity, pricing transparency and ease of access into the asset class.7
Over the last ten-plus years, the market environment was favorable for private infrastructure. Investors could take on leverage at very low rates, buy relatively cheap and exit at higher multiples, as multiples generally rose during this period (from 11 times EV/EBITDA in 2010 to 18 times in 2022).8 However, with higher interest rates (at around 6%), all-time high levels of dry powder, lower transaction activity and higher multiples (at 16 times EV/EBITDA), private infrastructure investors are currently facing a much more difficult environment and may have to lower their return expectations.
In our view, investors who had committed capital sitting on the sidelines over the last three years may have missed out on investing in listed infrastructure. Of the market’s $380 billion in dry powder, approximately 73% was raised from the start of 2021 through September 30, 2023, according to PitchBook Data, Inc.9 The listed infrastructure market has risen 30% from 2021 through July 2024. Given the macroeconomic backdrop, we believe unlisted multiples may continue to decline. At current relative multiples, now could be an opportune time for investors to consider reallocating some of their exposure from unlisted infrastructure to listed infrastructure, to capitalize on the valuation dislocation.
EV/EBITDA Multiples
Source: Bloomberg, RealfinX Platform, December 31, 2023.
Liquidity
Whether investors choose to go all in with listed infrastructure or allocate a portion of their infrastructure exposure to the listed market, they may benefit from added liquidity. With dealmaking at a decade low, falling valuation multiples and declining return outlooks, due in part to higher rates, this liquidity provides investors with the opportunity to adjust the duration of their portfolios and access their capital. Furthermore, in these challenging markets, we have seen instances recently of redemption limits being set on private infrastructure assets. In our view, this further underscores the liquidity appeal of publicly listed infrastructure.
Pricing Transparency
Valuing unlisted infrastructure can be challenging, as it is difficult to accurately assess the immediate risk/reward profiles of these assets. We have spoken with numerous valuation accountants and auditors who have highlighted that private infrastructure asset owners are afforded more discretion and subjectivity in their reporting, particularly more freedom to take a longer-term view when valuing their assets. This can enable private infrastructure fund managers to immunize their assets from material decreases in valuation. The lack of transparency can cause investors to misinterpret the true risks of private infrastructure assets within their portfolios, as volatility measures may be subdued by opaque and misunderstood valuation guidelines.
On the other hand, listed infrastructure offers real-time transparency with daily mark-to-market valuations, which we believe provide a more accurate depiction of associated risks. This was evident during the Covid-19 pandemic, when publicly listed equities were down over 30% while private benchmarks were down just 10%. As there are very few fundamental differences between the underlying assets of listed and unlisted infrastructure, we would expect them to yield similar results. However, due to the opacity of private infrastructure reporting, including the lack of visibility into the process and massive amounts of discretion afforded to private infrastructure fund managers, private companies were able to smooth out their reported risks.
Reported volatility for listed infrastructure assets may be higher due to daily mark-to-market pricing, full transparency of underlying risks and the inability of fund managers to underplay risks in their reporting. However, we believe that through a full market cycle the true underlying risks and rewards of private and publicly listed infrastructure are very similar, as evidenced by the similar performance profiles of the EDHEC Infra300® VW Equity Index and the S&P Global Infrastructure Index over the last ten years.
Diversifying into Listed Infrastructure
At Newton, we value the ability to invest in infrastructure with liquidity and pricing transparency. Private market valuations may continue to contract, and this may drag on the return outlook for private infrastructure, particularly relative to the last decade. For these reasons, and given the macroeconomic regime change over the last few years, we believe now may be an opportune time for investors to consider including public infrastructure in their infrastructure allocations. Diversifying into listed infrastructure may allow investors to generate similar returns while more effectively assessing the risk/reward trade-off in their portfolios.
1 RealfinX Platform
2 BCG Global. March 18, 2024. A Bump in the Road: Private Equity Infrastructure Investment Set to Rebound Following Slowdown in 2023. https://www.bcg.com/press/18march2024-private-equity-infrastructure-investment-set-to-rebound.
3 Realfin. Realfin State of the Market Report Global Infrastructure 2024. Accessed June 26, 2024. https://realfinprodstorage.blob.core.windows.net/files/2024_Realfin_State_of_Market_Global_Infrastructure_2.1.pdf?utm_source=Newsletter&utm_medium=email&utm_content=Your+requested+link+to+Realfin+State+of+the+Market+-+Global+Infrastructure+2024&utm_campaign=2024-RSOM-INFRA+auto+responder+%28LinkedIn%29&vgo_ee=tYgLHu%2FNcFOMhVXSkAwUbZ2xjW%2F%2FmBpfsftcfiDUixxku8Omw5k%2F51pdRtxq%2F1MK%3AqJkmYXlRoq3Zl9HjWeykIV6YVDQGCKA9.
4 PitchBook. As of September 30, 2023.
5 Bloomberg. Accessed June 26, 2024.
6 Realfin. Private infrastructure multiples cool in 2023. January 30, 2024. https://www.realfin.com/intelligence/private-infrastructure-multiples-cool-in-2023?utm_source=Newsletter&utm_medium=email&utm_content=Private+infrastructure+multiples+cool+in+2023&utm_campaign=2024-01-31+RWIB-INFRA
7 RealfinX Platform
8 RealfinX Platform
9 PitchBook. As of September 30, 2023.
Key points
- Attractive risk and reward characteristics can be found by focusing on income as well as growth in Asia.
- In the new regime of higher interest rates and inflationary pressures, there is likely to be more volatility. As such, we think it is important to be selective within any dividend-focused approach.
- We favour Singapore, which is host to many companies with strong balance sheets and decent payout ratios.
- In addition, we believe India offers significant potential given its long-term demographics, strong consumption and household income growth, as well as growing levels of urbanisation.
Investing in Asia has historically been focused on growth opportunities by using the region as a play on global gross domestic product (GDP) and export growth.
Instead, we believe more attractive risk and reward characteristics can be found by focusing on income as well as growth in the region.
We advocate diversification into Asia and focus on companies that can continue to pay dividends during times of macroeconomic uncertainty. Dividends play a key role in total returns for Asian investors and are the bedrock of income strategies.
In the new regime of higher interest rates and inflationary pressures, there is likely to be more volatility. As such, we think it is important to be selective within any dividend-focused approach.
Coupled with a change in growth dynamics, investor perspectives on investing in Asia could also be changing. Over the last decade, China’s internet platform companies have become a large part of the benchmark. However, valuations have been affected by regulatory concerns. We think this illustrates one of the pitfalls of focusing only on growth strategies in the Asia region, where valuations are not grounded by dividends.
By way of example, our Asian income portfolios are currently overweight in Singapore, which plays host to many companies with strong balance sheets and decent payout ratios. There is a lot of wealth and trade that goes through Singapore from its neighbouring nations. Banks in the region also have well-capitalised balance sheets and the ability to sustain higher dividends for years to come.
Another overweight is Taiwan, on the basis of opportunities around its many technology companies. We also see merits in Indonesia, which in our view emerged from the so-called ‘taper tantrum’ of 2013 stronger from current account and fiscal perspectives. We see strong growth coming out of that economy and think this is likely to continue.
We also believe India offers significant potential given its long-term demographics, strong consumption and household income growth, as well as growing levels of urbanisation. In other parts of Asia, ageing populations are supportive for income strategies because, as people grow older, there is a greater need for income to fund them in retirement.
Chipping in
On a thematic level, the technology sector provides investment opportunities. We believe artificial intelligence (AI), or more specifically companies supplying the hardware for AI, present interesting opportunities. Many of the technology companies held in our Asian Income strategy have net cash balance sheets and pay dividends, and we expect the AI industry to increase dividends as profits grow in the coming years.
Overall, we are broadly looking for balance-sheet strength, strong business models, and companies that have economic moats that give a competitive advantage. In other words, we favour quality franchises, with a degree of pricing power, which maintain profitability and margins – and pay dividends. Especially with Asia, we think the capital growth component of a portfolio’s total return is more volatile and less dependable than the income component.
By harnessing the potential of dividends and dividend growth, it is possible to compound total returns in a more consistent fashion than by trying to target growth on its own.
A version of this article first appeared on Morningstar.co.uk
Key points:
- Historically, publicly listed infrastructure investments have provided relatively stable absolute and risk-adjusted returns through market cycles.
- Listed-infrastructure securities are typically issued by companies with hard-asset-owning business models in heavily regulated industries, with contracts that allow them to pass inflationary pressures on to their end consumers.
- The stability of cash flows also provides downside support in difficult equity market environments.
Alternative investments are on the rise. These financial assets, which include hedge funds, private equity, real estate, infrastructure, commodities, private debt and liquid alternative mutual funds, accounted for 21% of global assets under management (AUM), or $20 trillion, in 2022. Currently, the growth trajectory for alternatives is second only to passively managed investments, with AUM expected to reach $29 trillion by 2027.1
For investors seeking to allocate to alternative investments, we believe listed infrastructure could be a compelling option. Infrastructure assets are expected to grow at a compound annual growth rate (CAGR) of 11% from 2022 to 2027, ultimately making up 7% of a $29 trillion global alternatives market.2 What are the key draws of listed infrastructure in the current environment? Listed infrastructure has historically delivered consistent mid-to-high single-digit total returns, above market yield. Furthermore, these assets may offer downside protection and a hedge against inflation, in addition to favourable long-term risk-adjusted returns relative to equities and other listed alternatives.
Current market environment
Inflation has begun to decelerate across developed economies, leading to a pivot in the expected path of interest rates. At the same time, governments are deploying trillions in global infrastructure funding to support energy-transition objectives and reshoring initiatives and to maintain aging infrastructure. Significant megaprojects, or large-scale projects that typically cost $1 billion or more, are expected to break ground in 2024 to reduce energy dependence and bring semiconductor supply chains closer to home.
Multiple infrastructure sectors, such as utilities and renewable energy, lagged in 2023 due to the rising interest-rate environment, as companies in these industries generally rely on debt markets to fund future growth. As the tide appears to be turning on the interest-rate front, sentiment for listed infrastructure is improving. Against this backdrop, our outlook for listed infrastructure is constructive, and we believe this alternative asset class could unlock opportunities for investors.
Stable returns and inflation protection
As shown below, listed infrastructure has delivered consistent mid-to-high single-digit total returns over the past 20 years, outperforming equities over that time period.3 The characteristics of listed infrastructure, which allow companies within the asset class to deliver income while also protecting against inflation, drive these steady return streams.
Income returns play a substantial role in the overall performance of listed infrastructure. Listed-infrastructure securities are typically issued by companies with hard-asset-owning business models in heavily regulated industries, with contracts that allow them to pass inflationary pressures on to their end consumers. These are typically dividend-paying equities, and as such can generate stable cash flows that similarly keep pace with inflation. Currently, infrastructure equities deliver a dividend yield twice that of global equities, as depicted below.4
The US inflation rate year over year has increased 3% or more during seven of the last 20 calendar years. During these seven years, listed-infrastructure equities have appreciated an average of 12.4%, versus global equities which have appreciated 7.5%.5 Likewise, infrastructure assets have been favourable investments historically when rates drop. US rates have fallen in 10 of the last 20 years, and in those 10 years, infrastructure has returned an average of 8.6%, while global equities have returned 7.7%.6
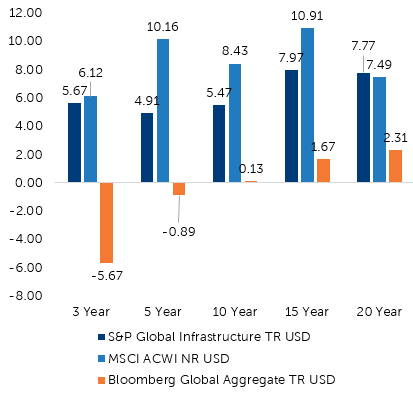
Annualised returns (Total return annualised month end)
Dividend yield
Downside protection and risk-adjusted returns
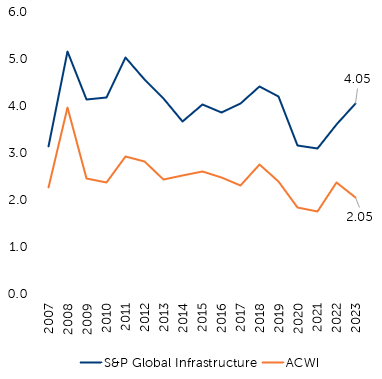
The stability of cash flows can also provide downside support in difficult equity market environments. Over the past 20 calendar years, the MSCI ACWI Index—which comprises large-cap and mid-cap equities across both developed and emerging markets—has dropped five times. In these down-market environments, listed infrastructure has fallen an average of 12.1%, as compared to global equities which have declined an average of 15.9%.7 This is evident in the downside capture ratio of the S&P Global Infrastructure Index versus the MSCI ACWI Index, which has generally been under 90% over the short and long term, indicating that infrastructure has declined only about 90% as much as the MSCI ACWI Index in the periods shown below.8
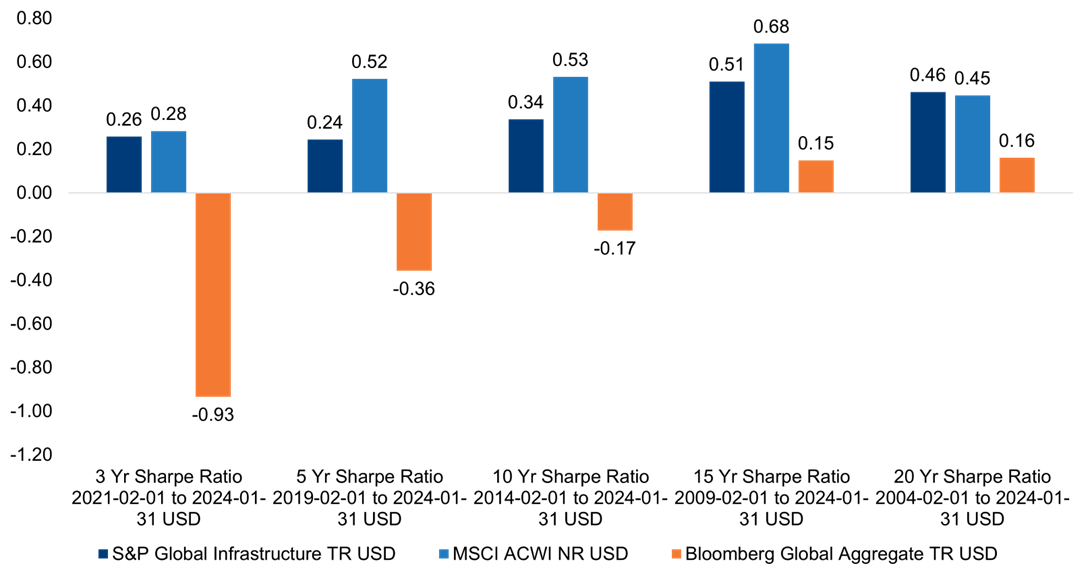
As illustrated in the chart below, infrastructure has delivered a higher Sharpe ratio (a measure of risk-adjusted return) versus equities over the past 20 years.9 The combination of relatively stable mid-single to high-single digit returns and downside protection, supported by the characteristics of listed infrastructure and stable cash flows, has resulted in positive risk-adjusted returns over the short, mid and long term.
Infrastructure downside capture ratio

Sharpe ratio
Multidimensional research support
Our approach to infrastructure investing is supported by our multidimensional research platform. Our research capabilities help us to more thoroughly evaluate investment opportunities and make better-informed decisions. Our specialists help us identify and investigate thematic tailwinds that could drive stock prices—such as decarbonisation, deglobalisation and aging populations. Our fixed-income analysts provide insights into the capital structure of our investments, while our investigative research team equips us with a better understanding of different regulatory environments and deeper research into our holdings and investable universe. Our specialist researchers speak with regulators, lobbyists, trade journalists, lawyers and market participants across the globe to explore the impacts of upcoming elections and evolving legislation, as well as potential risks and opportunities spanning telecommunication cables, wildfires, existing contracts, etc. Our multidimensional research team delivers an extra layer of insights, which we believe differentiates our approach to investing in publicly listed infrastructure.
Conclusion
Historically, publicly listed infrastructure investments have provided relatively stable absolute and risk-adjusted returns through market cycles. Infrastructure securities are issued by companies that provide services essential for societies and economies to function and thrive. These are generally companies that have hard-asset-owning business models in heavily regulated industries. Their revenues are often governed by long-standing contracts with built-in pricing increases linked to inflation, granting them the ability to pass inflationary pressures through to their clients. These mechanisms allow listed-infrastructure securities to deliver income while also protecting against inflation. In our view, there are considerable tailwinds supporting listed infrastructure securities and offering investors attractive opportunities in the space, especially those seeking yield and downside protection in turbulent markets.
[1] Boston Consulting Group. May 2023. https://web-assets.bcg.com/c8/97/bc0329a046f89c7faeef9ab6a877/bcg-global-asset-management-2023-may-2023.pdf
[2] Boston Consulting Group. May 2023. https://web-assets.bcg.com/c8/97/bc0329a046f89c7faeef9ab6a877/bcg-global-asset-management-2023-may-2023.pdf
[3] Morningstar as of 31 January 2024.
[4] Bloomberg as of 31 December 2023.
[5] Bloomberg and Morningstar. As of 31 December 2023.
[6] Bloomberg and Morningstar. As of 31 December 2023.
[7] Morningstar as of 31 December 2023.
[8] Morningstar as of 31 January 2024.
[9] Morningstar as of 31 January 2024.