
We assess the main drivers of an increase in renewables within the energy mix during the spring lockdowns.
- UK power demand was down 20-30%, versus the five-year average, during lockdown, but the total share made up of renewable energy increased sharply.
- The UK achieved a record low-carbon intensity for power generation of 21 grams of CO2 per kWh during lockdown as a result.
- The lockdown episode did provide a glimpse into the future of our energy system, and proved that a grid increasingly reliant on renewables works.
- The insight into the future provided by lockdown gives us more confidence in forecasting renewables growth further into the future.
The Covid-19 crisis continues to accelerate certain trends that were already in place before the pandemic took hold earlier this year. The so called ‘working from home winners’ incorporate the obvious area of technology, but also derivative areas such as home improvement, telemedicine and food delivery.
Here, we focus on another area being highlighted as a winner from the current backdrop – renewable energy. At the surface, this makes sense; politicians are demanding ‘green recoveries’ and initiating this with fiscal policies such as the European Union’s Green Deal to support the sector, which offers ‘shovel-ready’ jobs at scale.
However, given that an offshore wind farm takes around five years to plan, construct, and become operational, are we actually using more renewable energy today, and has the renewables market grown as a result of the pandemic? To fully answer these questions, we need to introduce two important concepts:
- Installed capacity: this is the amount of energy that renewables currently installed can produce today. Capacity is measured in watts: usually gigawatts (one GW = one million watts) or megawatts (one MW = 1,000 watts).
- Generated power: this is measured in megawatt hours (MWh) or gigawatt hours (GWh), and is the amount of power in watts generated in one-hour periods. For example, a wind farm with an installed capacity of 100 MW would generate 2,400 MWh in a day (24 times 100MW) if the wind blew continuously.
Falling demand in lockdown
Understanding these two concepts is important because Covid-19 did not materially change the global installed capacity of renewables (because they take a relatively long time to build, and the pandemic arrived relatively quickly). Furthermore, Covid-19 did not cause renewables to generate more power; after all, the wind and sun (sadly) did not achieve some sort of virus immunity and gain strength (as an aside, the UK was windier and sunnier than average during its lockdown period, which did drive above-average renewables generation). However, as businesses closed and industries ran below capacity, power demand fell significantly.
UK power demand during selected March-May 2020 lockdown period
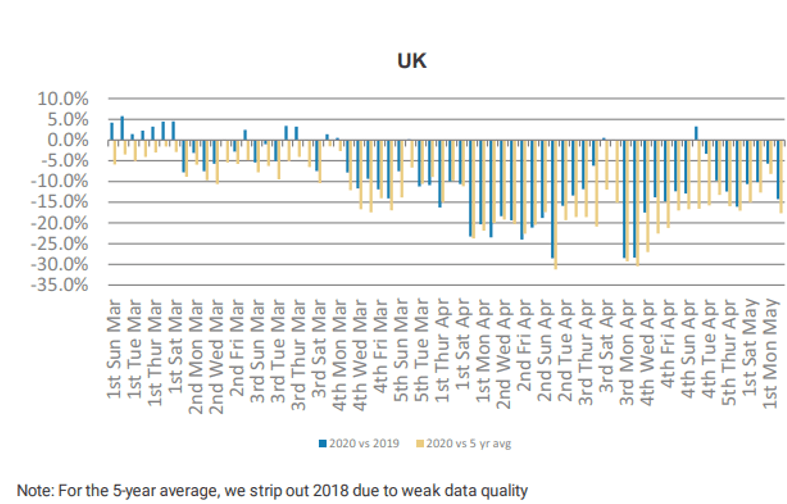
Source: ENTSO-E, May 2020
The chart above shows how UK power demand was down 20-30%, versus the five-year average, at the peak of the lockdown in early to mid-April. As power demand fell, the proportion of renewables comprising total supply rose from around 30% to 40% on average. This was because renewables have next to zero marginal cost given they have no fuel costs, and therefore it is logical to use as many renewables as possible. This was one of the main drivers of the lower power price seen during lockdown.
Record low carbon intensity
This also led to the UK achieving a record low carbon intensity for power generation of 21 grams of CO2 per kilowatt hour (kWh). The red triangles in the chart below show how lower demand for electricity during lockdown correlated with lower carbon intensity (the record low carbon intensity was recorded at a weekend, hence its exclusion from the chart).
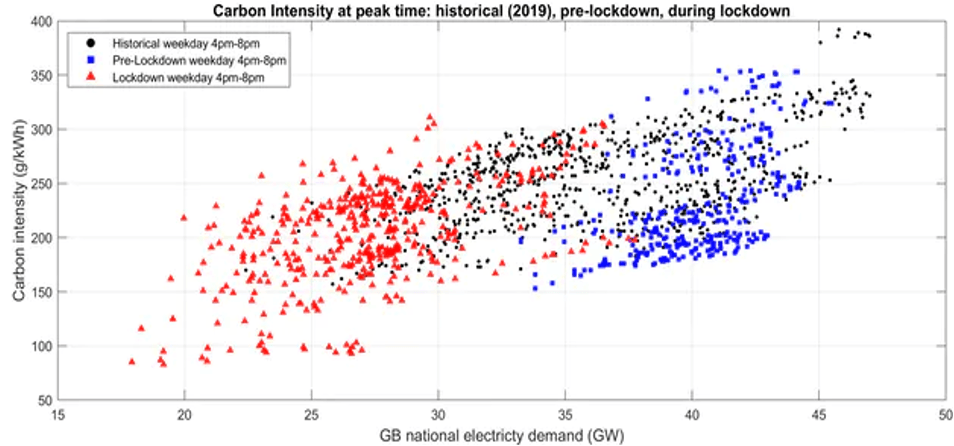
Author: T Yunusov; data: National Grid ESO, June 2020
As this trend played out, it was widely reported that Covid-19 was driving renewables growth, when in fact little had fundamentally changed regarding the sources of power generation. However, this episode did provide a glimpse into the future of our energy system, and proved that a grid increasingly reliant on renewables works. This successful ‘dummy run’ in the middle of lockdown may turn out to be a more important driver of true future growth in renewables capacity. Perhaps it is therefore no coincidence that the UK recently increased the already ambitious installed offshore wind-capacity target from 30GW by 2030 to 40GW.
Regulating energy frequency
While renewables were generally a success story through lockdown, there were some drawbacks. Renewables are inherently variable – the sun does not always shine, and the wind does not always blow – and the grid must make contingency plans in the event that renewables generate more or less power than expected. Through lockdown, National Grid, the UK’s electricity system operator, had to pay more flexible generators (i.e. not nuclear power stations, which can take hours to switch off) to shut down (there was a surplus of power) and levy ‘balancing charges’ to regulate frequency, given the mismatch in supply and demand. These costs are ultimately borne by us as consumers, but are small relative to the superior unit economics of renewables.
In terms of investment implications, this insight into the future provided by lockdown gives us more confidence in forecasting renewables growth further into the future. Assuming developers maintain their capital discipline, these companies should continue to generate returns in excess of the cost of capital and generate value for shareholders. In turn, this makes it easier to find upside when modelling renewables investments. It also highlights the structural importance of energy infrastructure, like electricity networks, which will be the backbone of the UK’s energy transition, as long as we continue to invest to maintain and modernise them.
Authors

Newton global research team
Our team of research analysts.
This is a financial promotion. These opinions should not be construed as investment or other advice and are subject to change. This material is for information purposes only. This material is for professional investors only. Any reference to a specific security, country or sector should not be construed as a recommendation to buy or sell investments in those securities, countries or sectors. Please note that holdings and positioning are subject to change without notice.


Comments